The Ultimate Guide to Control Charts in Six Sigma. Achieve Process Excellence
Control charts in Six Sigma are statistical process monitoring tools that help optimize processes by identifying variations.
They were introduced by Dr. Walter Shewhart as part of his work on statistical quality control in the 1920s. Control charts display process data over time which enables the identification of special and common causes of variation.
This helps determine if the process is stable and performing as intended or requires corrective action.
Six Sigma methodology relies heavily on control charts at different phases of the DMAIC framework, and is a core concept covered in our Six Sigma certification and training programs. At the Measure phase, control charts are utilized to establish a baseline for current process performance.
They aid in determining the sources of variation and capability of the process. At the Analyze and Improve phases, control charts play a vital role in verifying if implemented solutions have reduced variation and enhanced process capability.
This makes control charts a fundamental quality management tool in Six Sigma.
Master Control Charts and Process Optimization.
Gain knowledge of the Six Sigma roadmap and lead process improvement projects with our Lean Six Sigma Green Belt certification is designed for professionals who want to gain.

By identifying variation, control charts enable companies to determine if corrective actions need to be taken to improve product or service quality.
What are Control Charts in Six Sigma?
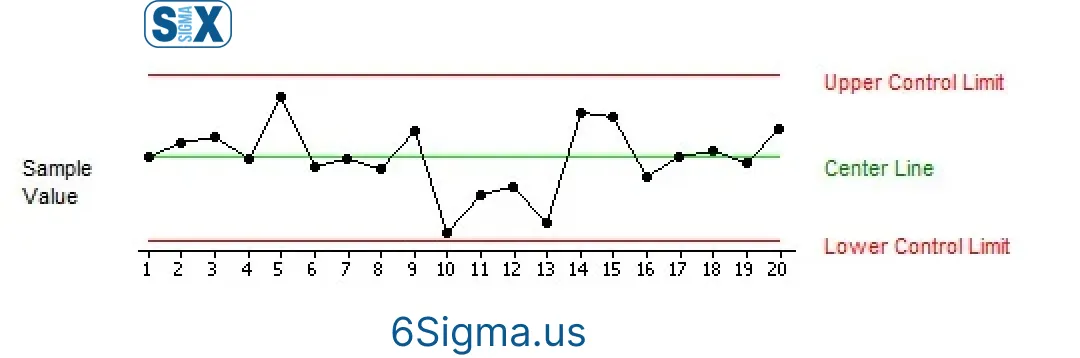
Control charts are graphical representations of process data over time. They show whether the manufacturing process is stable and operating within expected parameters through the use of statistical limits.
These limits, known as the upper control limit (UCL), lower control limit (LCL), and center line, establish boundaries for common cause variation.
Any points that fall outside these control limits suggest the possibility of special cause variation, warranting investigation into the process. This investigation often involves a thorough analysis of the root causes.
The two main components of a control chart are:
- Control limits: The UCL and LCL establish natural boundaries for variation in the process. Any points outside these limits suggest an assignable cause.
- Data points: Each point on the chart represents a data measurement from the process, such as defect counts, dimensions, etc. Tracking these points over time allows monitoring of process performance.
Significance of Control Charts in Six Sigma
Control charts play a crucial role in the Six Sigma methodology by enabling statistical process control (SPC). They are used extensively during the Measure and Analyze phases of the DMAIC approach to understand process capabilities and identify sources of variation.
By determining whether the manufacturing process is stable or experiencing assignable causes, control charts help Six Sigma teams select appropriate improvement projects.
They also allow teams to track the impact of implemented solutions by monitoring whether the process remains in control. Overall, control charts facilitate data-driven decision making which is a key tenet of Six Sigma.
Types of Control Charts
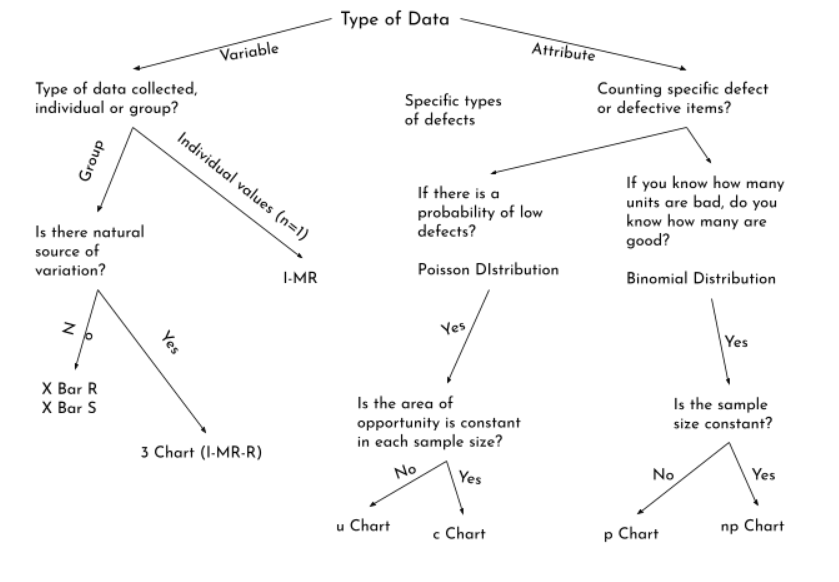
Control charts are crucial Six Sigma tools that help organizations monitor processes, identify variations, and drive improvements. Different types of control charts serve different purposes based on the process parameters being measured and the data being collected.
Control charts come in different types, each suited for monitoring a particular aspect of the process. The three most commonly used control charts are:
I-MR chart
The I-MR chart is used to monitor discrete or attribute-type data where the outcome can only be one of two possibilities (e.g. defect/no defect).
It plots the number of defects (I, for a number of nonconformities) against the moving range (MR, to monitor variability). This chart is effective in monitoring assembly line quality inspection data.
X bar & R chart
The X bar & R chart is used for variable data that results in a measured value along a continuous scale (e.g. weight, temperature).
It plots the mean (X bar) and range (R) of each subgroup of samples. This is one of the most commonly used control charts due to its flexibility in monitoring many manufacturing processes.
P chart
The P chart is similar to the I-MR chart but is used when the outcome can be defective or non-defective, and the focus is on the percentage of defectives (P).
It plots the percentage of defectives in each sample against the sample number. This chart is suitable for monitoring assembly defect rates.
Master Statistical Process Control with our short course — Introduction to Statistical Process Control.
Control Chart Components
Control charts have certain key components that help in interpreting the process performance and detecting abnormalities. Understanding these components is crucial for the correct analysis of control charts.
Center Line
The center line, also known as the mean line, represents the average or expected value of the quality characteristic being measured. It divides the control chart into upper and lower halves.
The center line is calculated as the mean of sample or subgroup averages. It serves as a reference to determine whether the process average is shifting up or down over time.
Control Limits
Control limits define the threshold for common cause variation. Data points within or on the control limits indicate that the process variation is due to normal or common causes.
The upper control limit (UCL) and lower control limit (LCL) are calculated based on the sample standard deviation and are set at a fixed number of standard deviations (typically 3) above and below the center line.
This ensures nearly 99.7% of the sample points lie within the control limits under statistical control.
Data Points
Data points represent the sample or subgroup average values plotted on the control chart over time. Each data point gives a snapshot of the process performance for that particular sample or time.
The position of the data point relative to the center line and control limits helps determine whether the process variation is due to common or special causes. Data points outside the control limits may indicate a change in the process requiring investigation and corrective action.
Control Chart Interpretation
Control charts help interpret process performance over time. Proper interpretation is important to determine if the process is stable and capable.
Process Monitoring
Control charts are used to monitor the process for any shifts or changes over time. They help detect if the process is behaving differently compared to when it was in statistical control.
Any points falling outside the control limits indicate a change or shift in the process, calling for corrective actions. This helps achieve process stability.
Variation Analysis
By analyzing the position and distribution of points within the control limits, important insights about process variation can be gained.
The variation can be classified as common cause variation, which is due to normal inherent causes in the system, or special cause variation, which arises due to assignable causes.
Control charts help identify the type of variation and determine if reducing variation can impact process performance.
Capability Analysis
Control charts also help assess if a process is capable of meeting specifications over time. Process capability indices like Cp, Cpk can be calculated using control chart data and compared with capability requirements.
This determines if the process meets customer needs and what improvements may be needed to enhance process capability.
For example, if data points are too close to the control limits, it indicates the process may not be capable.
Lead data-driven initiatives using a wide range of statistical tools.
Applications
Control charts have various applications in quality management, process improvement, and defect reduction.
Quality Management
Control charts are one of the most important quality tools for statistical process control and quality management.
They help organizations ensure their processes meet quality standards by monitoring for special and common cause variations. Any deviations from the control limits indicate the process is behaving unexpectedly and corrective actions need to be taken.
This allows organizations to deliver consistent quality products and services to their customers. Control charts also provide historical data on process performance, which is valuable for quality audits.
Process Improvement
Control charts play a vital role in continuous process improvement methodologies like Six Sigma. They facilitate data-driven decision-making by revealing issues like shifts, cycles, or trends in the production process.
Resolving assignable causes of variation identified using control charts leads to a more stable, centered process. Organizations can optimize their processes by maintaining them within the control limits and minimizing acceptable process variation.
This enhances process capability and improves productivity, efficiency, quality, and overall business performance.
Defect Reduction
Control charts effectively track defects and reduce rework costs by distinguishing normal process variation from abnormal defects.
They help pinpoint when and where defects are being introduced in the production process. Targeting the specific sources of variation brings defective parts per million (DPMO) down over time.
As a result, control charts support defect prevention activities, lower scrap rates, and increase customer satisfaction by delivering defect-free products and services.
Conclusion
Control charts are a vital statistical process control tool that helps organizations effectively implement the Six Sigma methodology. By understanding the different types of control charts and properly interpreting their outputs, businesses can gain valuable insights into process performance, variation, and capability.
Control charts enable continuous process monitoring to distinguish between common and special cause variations. This helps teams identify improvement opportunities and take prompt corrective actions to stabilize processes. The use of control limits also allows quantifying a process’s ability to meet specifications through parameters like Cp, Cpk, and Pp.
Control charts should be an integral part of any quality management or Six Sigma initiative. They provide a data-driven approach to make informed decisions, track process stability over time, and reduce defects by removing assignable causes of variation.
Organizations that leverage control charts for process optimization can expect significant benefits like improved productivity, lower costs, enhanced customer satisfaction, and increased profitability.
With the right implementation and ongoing monitoring, control charts ensure processes remain in statistical control.
SixSigma.us offers both Live Virtual classes as well as Online Self-Paced training. Most option includes access to the same great Master Black Belt instructors that teach our World Class in-person sessions. Sign-up today!
Virtual Classroom Training Programs Self-Paced Online Training Programs


