Six Sigma PPM: Mastering Defect Reduction for Operational Excellence
One of the core metrics in Six Sigma is Parts Per Million (PPM), which quantifies the defect rate or number of flawed units in a manufacturing or service process.
In its relentless pursuit of perfection, Six Sigma aims for a quality level where defects barely happen—no more than 3.4 defects per million chances (DPMO).
This intensely high benchmark also called the “Six Sigma level“, corresponds to an amazing 99.99966% defect-free rate. It sets a tremendous bar for process performance.
The PPM defective concept is straightforward yet profoundly impactful. It’s the expected number of flawed parts or instances out of one million opportunities.
By monitoring and minimizing PPM, businesses can boost customer satisfaction, cut waste, and continuously make processes better.
Key Highlights
- Understand the fundamental concept of PPM (Parts Per Million) defectives and its role in quantifying process performance.
- Learn how to calculate PPM using established formulas and methodologies, including DPMO (Defects Per Million Opportunities), DPU (Defects Per Unit), and DPO (Defects Per Opportunity).
- Appreciate the significance of PPM as a benchmark for setting quality goals, enabling continuous improvement, and enhancing customer satisfaction.
- Explore how PPM compares to other quality metrics.
- Discover best practices and Six Sigma methodologies.
- Gain insights into the application of PPM across various industries.
- Understand the critical steps involved in implementing a comprehensive Six Sigma PPM.
- Explore the future trends and advancements in Six Sigma methodologies.
We will explore the calculation, significance, and application across various industries. Also, examine how
Six Sigma methodologies, such as DMAIC (Define, Measure, Analyze, Improve, Control) and advanced statistical tools, can be leveraged to systematically reduce PPM and drive process excellence.
What Is Six Sigma PPM (Parts per Million) and Why Is It Important?
The pursuit of quality has become a relentless pursuit. At the core of this pursuit lies a critical metric –
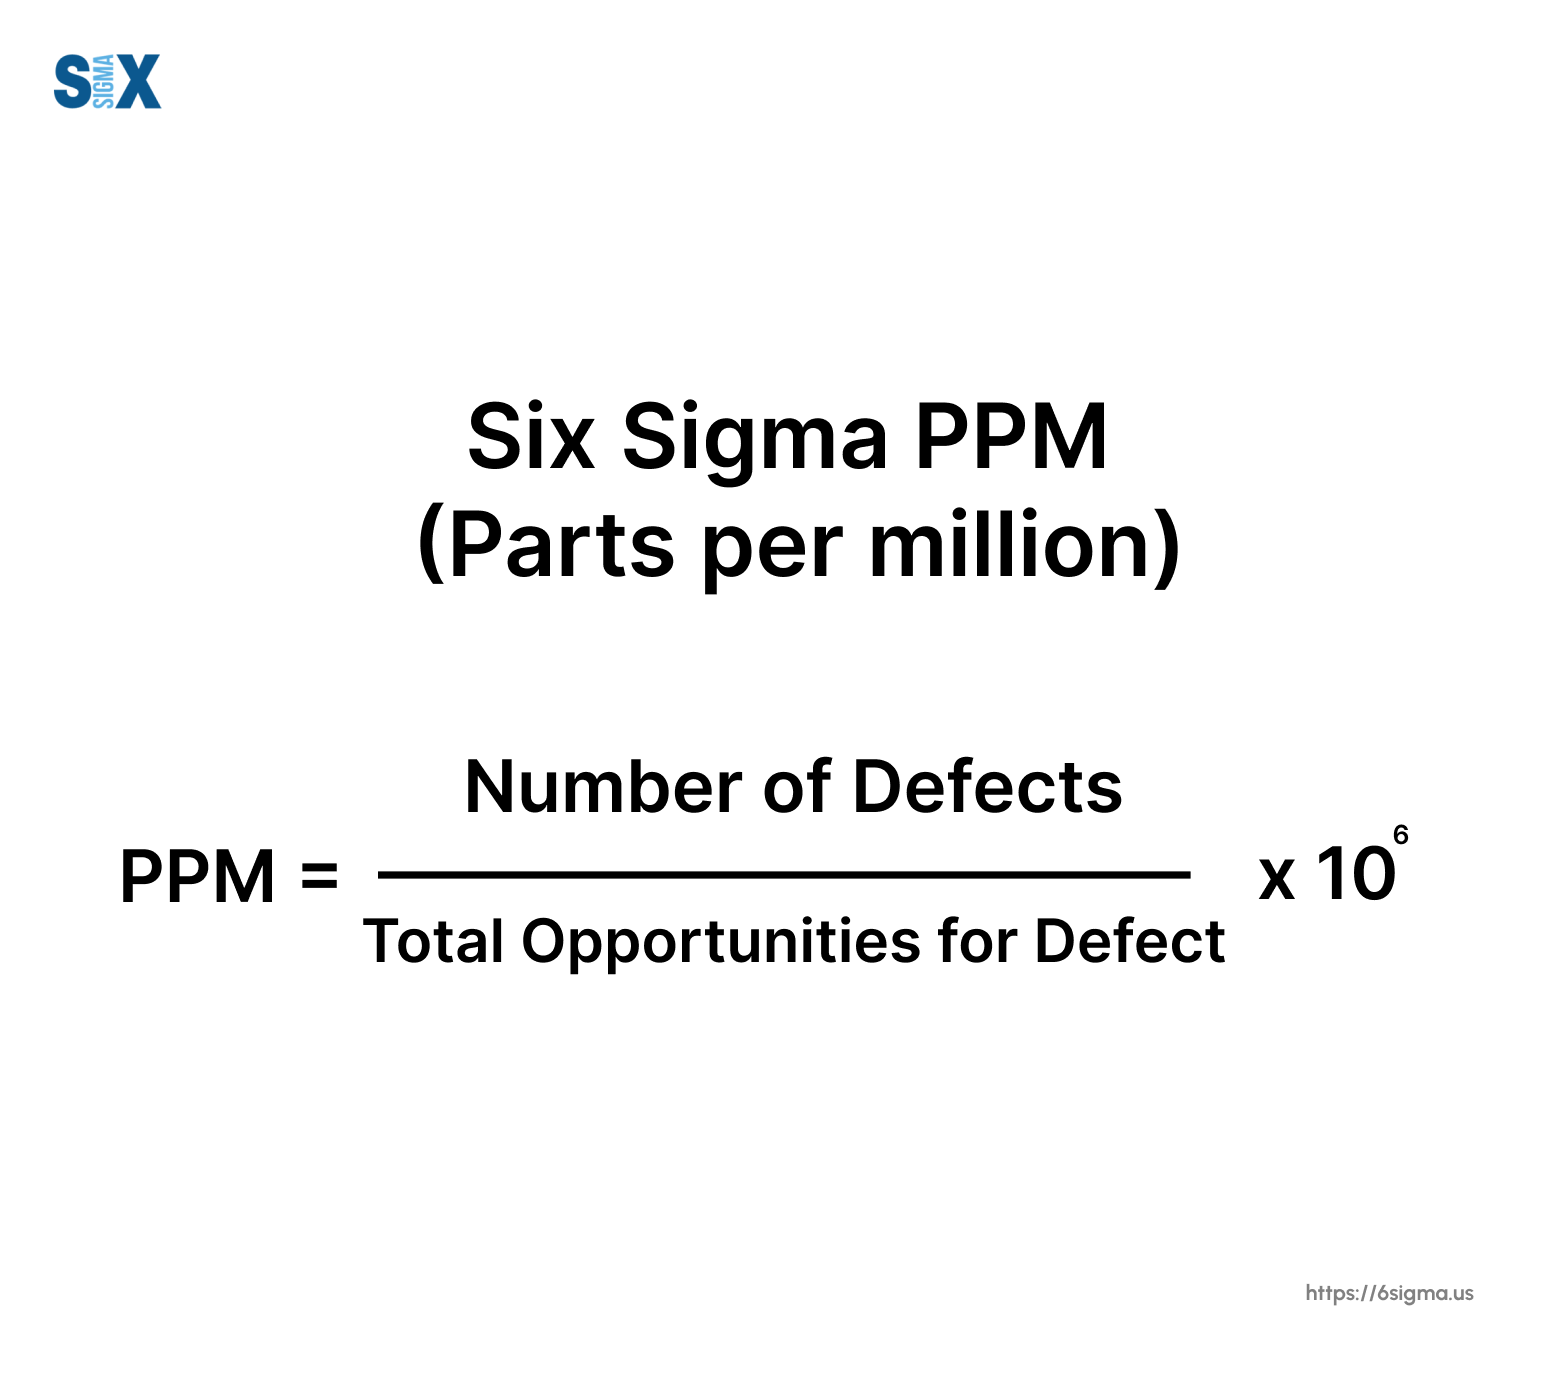
Parts Per Million (PPM) – a measure that quantifies the defect rate or the number of defective units in a manufacturing or service process.
Here is the formula to calculate PPM (Parts per Million)
Six Sigma methodology
Six Sigma is a disciplined, data-driven approach that aims to eliminate defects and variations in processes, ultimately enhancing customer satisfaction and bottom-line performance.
This proven methodology is based on the fundamental principle of reducing process variation to a level where the likelihood of producing defective products or services is exceptionally low – no more than 3.4 defects per million opportunities (DPMO).
Defects per million opportunities (DPMO)
The concept of Defects Per Million Opportunities (DPMO) is central to Six Sigma. It represents the number of defects or nonconformities that occur in a process per one million opportunities for a defect to occur.
For example, if a manufacturing process has ten steps, and each step represents an opportunity for a defect, then there are ten opportunities for a defect to occur per unit produced.
By tracking and minimizing DPMO, organizations can strive towards the coveted “Six Sigma level” of performance, which corresponds to a remarkable 99.99966% defect-free rate.
Process capability
Process capability is a statistical measure that evaluates the ability of a process to meet specified requirements or specifications.
In the context of Six Sigma, process capability is assessed using metrics such as process capability indices (Cp and Cpk), which provide a quantitative measure of how well a process is performing relative to its specifications.
By improving process capability, organizations can reduce variation, minimize defects, and ultimately achieve the desired level of quality.
Quality control
Quality control is an essential aspect of Six Sigma, involving the systematic monitoring and evaluation of processes to ensure that they consistently produce outputs that meet predetermined quality standards.
This is achieved through the implementation of various quality control tools and techniques, such as control charts, acceptance sampling, and statistical process control (SPC).
By maintaining rigorous quality control measures, organizations can detect and address process deviations promptly, preventing the occurrence of defects and ensuring consistent quality.
Understanding Six Sigma Parts Per Million (PPM) Defects
Six Sigma’s pursuit of excellence lies in the concept of PPM (Parts Per Million) defectives. This deceptively simple metric carries profound implications for organizations striving to minimize defects, enhance customer satisfaction, and drive continuous improvement within their processes.
Defect rate
PPM defectives represent the expected number of defective parts or instances out of one million opportunities. It serves as a standardized measure of the defect rate, enabling organizations to quantify and track the quality of their products or services over time.
By monitoring and minimizing PPM, companies can gain a clear understanding of their process performance and identify areas that require improvement.
Lean Six Sigma and Six Sigma PPM
PPM defectives is a crucial metric within the Lean Six Sigma framework, which combines the principles of Lean methodology (focused on eliminating waste and optimizing flow) with Six Sigma’s rigorous approach to defect reduction.
By integrating these complementary methodologies, organizations can streamline their processes, eliminate non-value-added activities, and minimize defects, ultimately enhancing efficiency and customer satisfaction.
Customer requirements and Six Sigma PPM
Meeting and exceeding customer requirements is paramount. PPM defectives serve as a powerful tool for organizations to demonstrate their commitment to quality and their ability to consistently deliver products or services that meet or exceed customer expectations.
By adhering to stringent PPM targets, companies can foster customer loyalty, enhance their reputation, and gain a competitive edge in their respective markets.
Measurement of quality
PPM defectives provide a quantitative measure of quality, enabling organizations to objectively assess and benchmark their performance against industry standards or their historical data.
By tracking PPM over time, companies can identify trends, monitor improvements, and make data-driven decisions to continuously enhance the quality of their processes and outputs.
Calculating Six Sigma PPM (Parts per Million)
Accurately calculating PPM defectives is crucial for organizations to gain meaningful insights into their process performance and to drive targeted improvement efforts.
Within the Six Sigma framework, several formulas and methodologies have been developed to calculate PPM, each offering a unique perspective on defect rates and process capabilities.
DPMO formula
One of the most widely used formulas in Six Sigma is the Defects Per Million Opportunities (DPMO) calculation.
DPMO represents the number of defects or nonconformities that occur in a process per one million opportunities for a defect to occur.
To calculate DPMO, the total number of defects is divided by the total number of opportunities for defects to occur, and the result is multiplied by one million.
For example, if a process has 50 defects and 10,000 opportunities, the DPMO would be calculated as (50 / 10,000) x 1,000,000 = 5,000.
Defects per unit (DPU)
Defects Per Unit (DPU) is another metric used in Six Sigma to quantify defect rates. DPU measures the average number of defects per unit produced or processed.
It is calculated by dividing the total number of defects by the total number of units produced or processed. DPU is particularly useful when analyzing processes where each unit has multiple opportunities for defects to occur, providing a more holistic view of the defect rate.
Defects per opportunity (DPO)
Defects Per Opportunity (DPO) is a complementary metric to DPU, focusing on the defect rate per individual opportunity for a defect to occur.
DPO is calculated by dividing the total number of defects by the total number of opportunities for defects to occur.
This metric is particularly useful when analyzing processes with multiple steps or operations, as it provides insights into the defect rate at each specific opportunity within the process.
Process performance metric
PPM defectives, along with its related metrics such as DPMO, DPU, and DPO, serve as valuable process performance indicators within the Six Sigma framework.
By consistently tracking and analyzing these metrics, organizations can gain a comprehensive understanding of their process performance, identify areas for improvement, and make informed decisions to drive continuous process excellence.
The Significance of PPM in Six Sigma
The importance of PPM defectives in Six Sigma cannot be overstated.
This powerful metric serves as a cornerstone for organizations striving to achieve operational excellence, drive continuous improvement, and ultimately enhance customer satisfaction and profitability.
Continuous improvement
Six Sigma is founded on the principle of continuous improvement, and PPM defectives play a pivotal role in this pursuit.
By consistently monitoring and analyzing PPM data, organizations can identify areas of their processes that require attention, implement targeted improvement initiatives, and track the effectiveness of these efforts over time.
This data-driven approach ensures that improvement efforts are focused and impactful, resulting in tangible and sustainable enhancements to process performance.
Customer satisfaction
Customer satisfaction is the ultimate differentiator. PPM defectives serve as a direct reflection of an organization’s ability to consistently deliver high-quality products or services that meet or exceed customer expectations.
By minimizing PPM, companies can foster customer loyalty, enhance their reputation, and gain a competitive edge in their respective markets.
Benchmarking and Six Sigma PPM
PPM defectives provide a standardized and widely recognized measure for comparing process performance across different industries, organizations, and even within the same company.
This enables organizations to benchmark their performance against industry standards, best practices, or their historical data, identifying areas for improvement and setting achievable targets for process excellence.
Quality goals
Within the Six Sigma framework, PPM defectives serve as a key metric for setting quality goals and objectives.
By establishing PPM targets aligned with Six Sigma principles, organizations can continuously strive for higher levels of quality, driving process improvement and enhancing overall performance.
Six Sigma PPM Vs. Other Quality Metrics
While PPM defectives is a critical metric in Six Sigma, it is not the only measure of quality used within the methodology. Several other metrics and tools are employed to provide a comprehensive view of process performance and to facilitate targeted improvement efforts.
Yield (First Pass Yield & Rolled Throughput Yield)
Yield metrics, such as First Pass Yield (FPY) and Rolled Throughput Yield (RTY), are commonly used in Six Sigma to assess the proportion of units or products that pass inspection or meet specifications on the first attempt.
FPY measures the percentage of units that pass inspection without requiring rework or repair, while RTY accounts for units that may have been reworked or repaired and subsequently passed inspection.
These yield metrics complement PPM defectives by providing insights into the efficiency and productivity of processes.
Defect concentration diagram
The defect concentration diagram is a powerful visual tool used in Six Sigma to identify and prioritize areas within a process that contribute the most to defects or nonconformities.
By graphically representing the distribution of defects across different process steps or components, this diagram helps organizations focus their improvement efforts on the most critical areas, maximizing the impact of their initiatives.
Control charts
Control charts are statistical tools used in Six Sigma to monitor and control process performance over time.
By plotting process data against predetermined control limits, these charts help identify when a process is operating within acceptable limits or when it deviates from the expected performance.
Control charts provide real-time insights into process stability and enable organizations to take corrective actions promptly, preventing the occurrence of defects and maintaining consistent quality.
Process sigma level
The process sigma level is a metric that quantifies the capability of a process to produce outputs within specified limits or specifications.
It is calculated based on the process mean and standard deviation, and is expressed in terms of a sigma level (e.g., 3 Sigma, 4 Sigma, 6 Sigma). A higher sigma level indicates a more capable process with a lower defect rate.
While PPM defectives directly measure the defect rate, the process sigma level provides a complementary perspective on process capability, enabling organizations to assess and improve their processes holistically.
Improving PPM with Six Sigma Methodology
Improving PPM defectives is a continuous journey that requires a systematic and data-driven approach.
Six Sigma provides a robust framework and a suite of tools and techniques to systematically identify, analyze, and eliminate root causes of defects, ultimately driving sustained improvements in process performance and quality.
Define-Measure-Analyze-Improve-Control (DMAIC)
The Define Measure Analyze Improve Control (DMAIC) methodology is the cornerstone of Six Sigma’s improvement efforts. Mastery of DMAIC is a key focus of Six Sigma Green Belt certification, equipping practitioners to lead targeted process optimizations.
This structured approach guides organizations through the key phases of a project, ensuring a focused and disciplined approach to problem-solving and process improvement.
- Define: Clearly define the problem, project goals, and customer requirements.
- Measure: Establish baseline performance metrics, including PPM defectives, and collect relevant process data.
- Analyze: Use statistical tools and techniques to analyze the data, identify root causes of defects, and determine potential solutions.
- Improve: Implement solutions and improvement initiatives to address the root causes and optimize process performance.
- Control: Establish control measures to ensure sustained improvements, monitor performance, and enable continuous improvement.
Root cause analysis
Root cause analysis is a critical component of the Six Sigma methodology, enabling organizations to identify and address the underlying causes of defects or process variations.
By employing a range of tools and techniques, such as cause-and-effect diagrams, 5 Whys analysis, and fault tree analysis, Six Sigma practitioners can systematically analyze process data and uncover the root causes of defects, paving the way for targeted and effective improvement initiatives.
Best Practices for Reducing Six Sigma PPM
Reducing PPM defectives is a multifaceted endeavor that requires a comprehensive approach and the adoption of best practices.
Design of Experiments (DoE)
Design of Experiments (DoE) is a powerful statistical technique that plays a crucial role in reducing PPM defectives.
DoE enables organizations to systematically investigate the impact of various factors and their interactions on process performance and quality.
By carefully designing and executing experiments, Six Sigma practitioners can identify the critical factors influencing defect rates and optimize process parameters to minimize PPM.
DoE not only helps in identifying root causes but also provides insights into process robustness, enabling organizations to develop robust solutions that are less susceptible to variations.
Mistake-proofing (Poka-Yoke)
Mistake-proofing, also known as Poka-Yoke, is a lean manufacturing concept that focuses on preventing mistakes or defects from occurring in the first place.
This proactive approach involves implementing simple, cost-effective devices or methods that physically prevent errors or provide immediate feedback when a mistake occurs.
Poka-Yoke techniques, such as physical barriers, warning signals, or procedural checks, can be highly effective in reducing PPM defectives by eliminating the potential for human error and ensuring consistent adherence to quality standards.
Value stream mapping for reducing Six Sigma PPM
Value stream mapping is a lean technique that provides a comprehensive visual representation of the flow of materials and information throughout a process.
By mapping the entire value stream, organizations can identify waste, bottlenecks, and areas of inefficiency that contribute to defects or quality issues.
Value stream mapping enables Six Sigma practitioners to analyze the process holistically, identify opportunities for improvement, and implement targeted solutions that streamline the flow, eliminate non-value-added activities, and ultimately reduce PPM defectives.
Lean manufacturing
Lean manufacturing principles, such as reducing waste, optimizing flow, and fostering continuous improvement, are closely aligned with the objectives of Six Sigma. Understanding the fundamentals of Lean is essential for professionals aiming to integrate these methodologies effectively
By integrating lean concepts into the Six Sigma methodology, organizations can create a powerful synergy that combines the defect reduction capabilities of Six Sigma with the efficiency and waste elimination focus of lean.
Lean tools like 5S (Sort, Set in Order, Shine, Standardize, Sustain), visual management, and just-in-time production can significantly contribute to reducing PPM defectives by creating an organized, streamlined, and efficient manufacturing environment.
Six Sigma PPM in Different Industries
The pursuit of minimizing PPM defectives is not limited to a specific industry or sector.
Organizations across a wide range of industries have embraced Six Sigma methodologies and leveraged the power of PPM to drive process excellence and enhance customer satisfaction.
From manufacturing to healthcare and services, the impact of PPM defectives is far-reaching and transformative.
Manufacturing (automotive, electronics)
The manufacturing sector, particularly the automotive and electronics industries, has been at the forefront of adopting Six Sigma methodologies and implementing PPM defectives as a key performance indicator.
In these regulated industries, even minor defects can have severe consequences, ranging from customer dissatisfaction to safety issues and costly recalls.
Six Sigma PPM in Healthcare
In the healthcare industry, where human lives are at stake, the importance of minimizing defects and errors cannot be overstated.
Six Sigma and PPM defectives have been instrumental in improving patient safety, enhancing the quality of care, and reducing medical errors.
Services (finance, hospitality)
While traditionally associated with manufacturing, Six Sigma and PPM defectives have also gained significant traction in the service sector, including finance and hospitality.
In the finance industry, minimizing defects in processes such as loan approvals, account management, and regulatory compliance is crucial for maintaining customer trust and avoiding costly errors.
Similarly, in the hospitality industry, PPM defectives can be applied to enhance guest experiences, streamline operations, and ensure consistent service delivery across multiple locations.
Case Studies and Examples of Six Sigma PPM (Parts per Million)
To illustrate the broad application and impact of PPM defectives, it is helpful to examine real-world case studies and examples.
For instance, a leading automotive manufacturer leveraged Six Sigma methodologies and focused on reducing PPM defectives in their welding process, resulting in significant cost savings and improved customer satisfaction.
In the healthcare sector, a renowned hospital system implemented Six Sigma techniques to reduce medication errors, achieving a remarkable reduction in PPM defectives and enhancing patient safety.
These success stories highlight the transformative power of PPM defectives and Six Sigma methodologies across various industries.
Implementing Six Sigma PPM Tracking
Implementing a robust system for tracking PPM defectives is a critical component of any successful Six Sigma initiative.
By establishing a comprehensive tracking framework, organizations can gain valuable insights into process performance, identify areas for improvement, and monitor the effectiveness of their improvement efforts over time.
Data collection
Accurate and reliable data collection is the foundation of effective PPM defective tracking. Organizations must establish standardized procedures and protocols for collecting data related to defects, opportunities, and process outputs.
This may involve implementing automated data collection systems, training personnel on proper data recording techniques, and ensuring data integrity through regular audits and quality checks.
Process mapping
Process mapping is a crucial step in understanding the flow of materials, information, and activities within a process.
By creating detailed process maps, organizations can identify all potential opportunities for defects to occur, enabling accurate PPM defective calculations and targeted improvement efforts.
Process mapping also helps to identify bottlenecks, waste, and non-value-added activities that may contribute to defects or process variations.
Project selection
Effective PPM defective tracking requires a strategic approach to project selection.
Organizations should prioritize processes or areas with the highest potential for improvement, considering factors such as customer impact, cost implications, and strategic alignment.
By focusing on high-impact projects, organizations can maximize the return on their improvement efforts and drive meaningful reductions in PPM defectives.
Change management
Implementing Six Sigma methodologies and tracking PPM defectives often requires significant changes in processes, procedures, and organizational culture.
Effective change management is crucial to ensure a smooth transition and sustained success.
This involves communicating the objectives and benefits of the initiative, providing training and support to employees, addressing resistance to change, and fostering a culture of continuous improvement.
The Road to Six Sigma Excellence
Pursuing operational excellence through Six Sigma demands a commitment to constant betterment, leadership all-in, and making quality a core part of company culture.
As we work towards Six Sigma success, it’s crucial to recognize PPM defectives’ pivotal role as a guidepost and driving force for boosting processes and reducing flaws.
Achieving and sustaining Six Sigma success means cultivating a culture of continued improvement throughout the business.
This culture fosters an unwavering focus on finding and removing defects. It also promotes staff investment and empowerment plus a mindset of ongoing learning and growth.
By weaving continuous improvement into the company’s fabric, businesses establish a self-sustaining cycle of defect reduction, process refinement, and quality achievements down the road.
Six Sigma continues evolving, with fresh methods, tools, and technologies elevating defect cutting and process optimization.
Companies must stay atop these advances and integrate them into Six Sigma projects.
Emerging areas like blending Six Sigma with Industry 4.0, advanced analytics, and machine learning, plus niche Six Sigma applications will shape PPM defect reduction’s future and drive quality and operations to new heights.
SixSigma.us offers both Live Virtual classes as well as Online Self-Paced training. Most option includes access to the same great Master Black Belt instructors that teach our World Class in-person sessions. Sign-up today!
Virtual Classroom Training Programs Self-Paced Online Training Programs


