Top 3 Process Behavior Charts
“Process behavior chart” or “control chart” is such a broad term. When you have decided to track the performance of a process visually using a process behavior chart as one of the tools, you have to settle on which chart type to use. While there a number of control charts to choose from, there are some that are used more often than others.
These are:
- x̅ and R chart
- x̅ and S chart
- X-MR chart
Understanding what they are can help you determine how to best use them. Ultimately, the type of chart you end up using will depend on two things: what you want to understand about the performance of the process and the kind of data you would like to represent.
1. x̅ and R chart
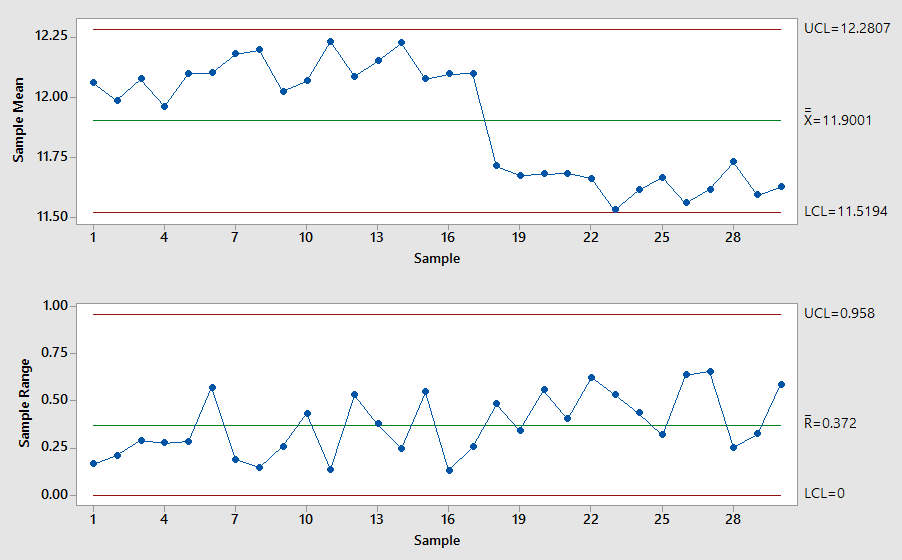
The x̅ (pronounced X-Bar) and R chart is probably the most commonly used process behavior chart when it comes to determining the stability of a process. Basically, this chart uses variable data to plot the mean (x̅ chart) and range (R-Chart) of a process over a period of time. To use the x̅ and R chart, the data must be continuous (collected at regular intervals) and arranged into subgroups.
This chart only works well if the subgroup size is not greater than eight. If the size of an individual subgroup happens to be more than eight, then you need to use an x̅ and S chart, which we will talk about in more detail in the next section. Subgroups include things like blood pressure of hospital patients, lengths of manufactured parts and even call times.
Take a look at the figure below for an example of an x̅ and R chart (x̅ chart is on top and R chart is below):
Normally, the x̅ and R chart has three common uses (these uses also apply to the other two charts mentioned in this article). These are:
- Tracking the stability of a process: As you know, each process will produce some level of variation. If the variation is normal, trying to fix minor fluctuations due to normal random variation can lead to unnecessary tampering of the process. This needs to be avoided.
- Figuring out if a process needs improvement: Before making changes to a process, you need to confirm whether it is stable or not. Only make changes to processes that aren’t stable.
- Accessing if improvement efforts were successful: If you have a process that is unstable and made changes to it, this chart will help you determine if the changes had the desired effect.
2. x̅ and S chart
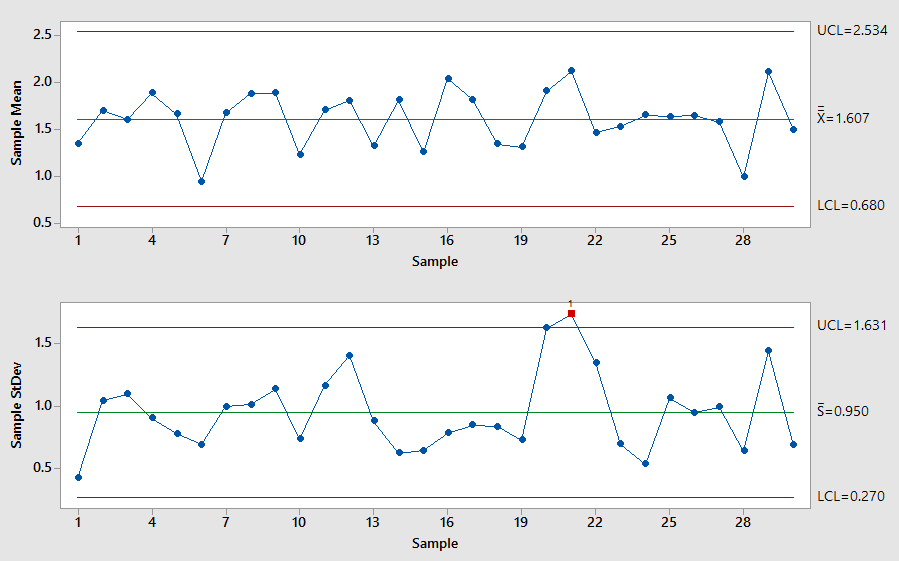
An x̅ and S chart is similar to the x̅ and R chart. But there are two key differences to keep note of. The first difference is that this chart uses the variable data to plot the mean and standard deviation (S chart) rather than the range. The second difference is – as mentioned earlier – while the data also needs to be continuous and arranged is subgroups, the size of a subgroup can be greater than eight.
The figure below shows what an x̅ and S chart looks like (x̅ chart is on top and R chart is below):
3. X-MR chart
Another common process behavior chart is the X-MR (individuals and moving range) chart. It uses variable data to chart the individual (X), which is a single subgroup, and its moving range (MR) over time. At this point, you may have noticed we are talking about charts that use variable data (there are other process charts that use attribute data). The MR in the chart represents the variability between adjacent individual members in the subgroup.
The figure below shows what an X-MR chart looks like (X chart is on top and MR chart is below):
Ever since they were introduced in the 1920s by Walter Stewart, process behavior charts, or control charts, have become one of the staples of process improvement, especially in Six Sigma. But a big part of what makes them effective is knowing which chart type to use for tracking the performance of a process. While there are more process behavior charts out there, these three types are worth knowing since they are commonly used.
Know more about our Six Sigma Training Programs
SixSigma.us offers both Live Virtual classes as well as Online Self-Paced training. Most option includes access to the same great Master Black Belt instructors that teach our World Class in-person sessions. Sign-up today!
Virtual Classroom Training Programs Self-Paced Online Training Programs


