fbpx

Articles

Image: P-charts

Six Sigma Terminology – P chart. What is it and How it Works

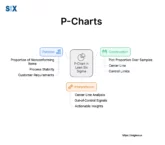
Organizations bank on reliable quality and minimal defects fuelling success. An outstanding ally hitting that target involves the p-chart, also known as the proportion control chart. This potent statistical technique tracks and analyzes non-compliant piece rates over time within methods. It’s handy when data classifies each unit simply as “hits standard” or “misses standard” based […]

View More

How Six Sigma Can Measure your Process Waste Level

Within Six Sigma are a few methods that most practitioners will follow. Of course, everyone requires different outcomes from their process improvements and thus will use different sets and combinations of methods and tools. However, Six Sigma has one key underlining task that almost every organization strives for – reducing waste. This can range from […]

View More