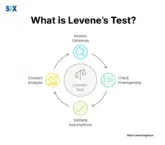
Levene’s Test: Your Guide to Understanding, Performing, and Interpreting Homogeneity of Variance
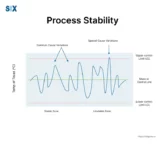
Variations in data, especially when making business decisions might end up in fatal errors. Assessing this variability in data is crucial, and that’s where Lavene’s test stands as a robust and proven method to evaluate whether data in different groups have equal variances. Levene’s test holds as a fundamental block for many advanced analytical methods […]