A Complete Guide to Six Sigma Defects Per Million (2025)
Achieving consistent and predictable business process performance is crucial for delivering value to customers. However, variability, defects, and errors threaten this objective, eroding quality and driving up costs.
To systematically enhance process capability, organizations leverage Six Sigma – a rigorous methodology centered on statistical thinking and defect elimination. Professionals equipped with a Six Sigma certification are trained to apply these principles to streamline operations and reduce variability.
Transform Process Variability into Precision!
Get a Lean Six Sigma Green Belt Certification and master defect reduction techniques.

DPMO offers a way to quantify how many defects or mistakes occur per million chances for them to happen.
By measuring defect frequency, DPMO establishes a baseline to compare process outcomes, pinpoint quality gaps, and steer improvements via evidence-based analysis. A lower DPMO score signifies a higher process sigma rating, lower variation from perfection, and superior reliability.
What is Six Sigma Defects per Million?
Six Sigma defects per million refer to a key metric and concept within the Six Sigma methodology for quality improvement and process enhancement. Specifically, it represents the number of defects per million opportunities that are likely to occur in a business process.
The Six Sigma methodology aims to improve process outputs by identifying and eliminating the root causes of defects and variations. A foundational premise is that all processes can be measured, analyzed, improved, and controlled.
Defects per million opportunities (DPMO) offers a standardized way of quantifying the presence of defects in a process. It measures how many defects could potentially happen for every million opportunities where an error or discrepancy might occur.
A lower DPMO value corresponds to better process performance and higher quality. As processes are improved using Six Sigma techniques, the DPMO rating drops, indicating that defects are being systematically reduced.
Role in Six Sigma Methodology

DPMO plays a pivotal role in Six Sigma initiatives and projects, a core focus of Six Sigma Green Belt certification programs. These programs teach practitioners to establish baselines, measure process capability, and set tangible goals for defect reduction.
Each Six Sigma process sigma level has a target DPMO value. For example, a Six Sigma process has a DPMO of only 3.4, meaning that statistically only 3.4 defects occur per million opportunities. This translates to near-perfect quality with 99.99966% accuracy.
Relation to process improvement
By providing a standardized defect rate, DPMO enables comparative analysis across different processes within an organization. It becomes easier to identify processes that need priority focus for improvement.
As DPMO ratings shift downwards through successive efforts, processes become more efficient and aligned with customer requirements. This drives increased satisfaction, potential for innovation, and cost competitiveness.
Six Sigma defects per million is a vital metric that catalyzes and Steers process improvement via the Six Sigma methodology. It quantifies quality issues and guides enhancement initiatives.
Deepen your understanding of Six Sigma methodologies with our comprehensive Green Belt training.
Calculating Six Sigma Defects per Million
To quantify and monitor process performance using the Six Sigma methodology, defects per million opportunities (DPMO) need to be accurately calculated. This requires collecting and analyzing quality data to determine the current sigma rating and defect levels.
There are two formulas for arriving at DPMO based on the type of data available:
- Population DPMO: When complete data for the entire population of products/services is accessible.
- Sample DPMO: When only a sample data set is available due to the infeasibility of measuring the entire output.
Formulas for population vs sample data
Population DPMO formula:
DPMO = (Total number of defects / Total opportunities for defects) x 1,000,000
Here, the defects and opportunities pertain to the full population size.
Sample DPMO formula:
DPMO = (Number of defects / Number of units in sample x Opportunities for defect per unit) x 1,000,000
This estimates the defect rate based on a representative sample’s quality performance.
The steps for calculation involve:
- Determining sample size
- Identifying opportunities for defect per unit
- Finding defect opportunities for sample
- Counting total defects in the sample
- Applying the formula
Accurately calculating DPMO is crucial for setting valid baselines for improvement initiatives. The population versus sample formula is applied appropriately based on data constraints.
Tools for calculation (Excel, Minitab, etc)
There are several software tools and platforms that can be leveraged to compute defects per million opportunities (DPMO) accurately and efficiently:
Excel Spreadsheets: Excel provides in-built statistical functions along with easy table/data manipulation features to calculate DPMO, a skill emphasized in foundational Six Sigma Yellow Belt certification for process analysts
Quality Management Software: Tools like Minitab, Quality Companion, SigmaXL, etc. specially meant for quality improvement techniques contain specific functions for DPMO calculation. They eliminate manual errors.
Online DPMO Calculators: Simple web-based calculators allow inputting the formula variables to automatically calculate DPMO. Useful for quick, one-time assessments.
Business Intelligence Software: Solutions like Tableau, Power BI, and Qlik can take in large-quality data sets and run DPMO computations seamlessly. Visualizations identify patterns.
Statistical Programming Software: Platforms such as SAS, R, and Python having statistical capabilities can customize DPMO analysis as per required assumptions/models. Handle complex scenarios.
Step-by-step manual calculation walkthrough
The steps to manually compute sample DPMO are:
- Select sample size – For demonstration, let’s take the sample size as 500 units
- Define defect opportunities per unit – For example, 5 defect opportunities per unit
- Compute total opportunities for defects in sample = Sample size x Defect opportunities per unit
Here, 500 units x 5 opportunities = 2500 opportunities
- Count number of defects found across the sample = 135 defects
- Apply the DPMO formula:
DPMO = (Number of defects / Number of units x Opportunities per unit) x 1,000,000
DPMO = (135/500 x 5) x 1,000,000 = 135,000
Therefore, the DPMO rating is 135,000 defects per million opportunities.
Following these step-by-step calculations manually or using appropriate tools facilitates accurate DPMO measurement for Six Sigma initiatives.
Learn how to efficiently calculate and analyze DPMO using Minitab with our Minitab Essentials course.
Interpreting Six Sigma Defects per Million
Once the defects per million opportunities (DPMO) is accurately calculated for a process, the next step is interpreting its implication on quality and performance. The DPMO value signifies the short-term and long-term sigma rating which determines how well the process is functioning.
A lower DPMO denotes better quality and less variation from perfection. It translates to higher process sigma levels and indicates excellent consistency. On the other hand, a higher DPMO implies higher defects, lower capability, and a need for improvements.
Small vs large standard deviations
The DPMO specifically provides insight into the process variation by showing how widely dispersed the actual performance is from the ideal or desired performance.
A small standard deviation and DPMO indicate that most observations fall very close to the average while a large standard deviation and high DPMO suggest that the observations are widely spread out from average.
A DPMO value of zero represents zero defects and zero variation. As the DPMO score rises, it indicates larger deviations and frequency of defects. Appropriate data visualization techniques like statistical modeling, probability curves, histographs, etc. can facilitate interpretation.
By distinguishing between small and large standard deviations using DPMO, priority areas for reducing variability and enhancing process stability can be identified. This drives effective quality improvement initiatives.
Impact on process variability and quality
The defects per million opportunities (DPMO) have a direct correlation with process variability and quality. A lower DPMO indicates minimum variation and superior quality while a higher rating signals high variability and poor quality.
Every process has an inherent amount of natural variability that cannot be eliminated. However, special causes of variation can be addressed through process enhancements. As DPMO decreases, variability reduces, and quality improves.
For example, an automated manufacturing line with integrated inspection may have 30,000 DPMO whereas a manual assembly process may exhibit 90,000 DPMO for the same product. The automated line demonstrates better consistency and reliability.
Using standard deviation analysis to identify improvements
By using statistical analysis techniques, the element contributing most to higher standard deviation and DPMO can be identified. For instance, measurement system analysis can evaluate if inspection equipment variability is the root cause for wide quality fluctuations.
Other approaches like hypothesis testing, correlation analysis, process capability analysis, factorial experiments, etc. assess the influence of controllable factors like temperature, pressure, speed, etc. on output variability.
The factors showing maximum positive correlation and significance to variability become targets for improvement through control mechanisms, automation, etc. to reduce DPMO and enhance process capability. They help align overall performance to Six Sigma goal levels.
Six sigma defects per million in Practice
While defects per million opportunities (DPMO) provides a metric to evaluate the current state of a process, its true value lies in actually leveraging it to control and improve quality over time. This requires deploying the DPMO within a structured statistical process control (SPC) framework for sustaining gains.
Application in statistical process control (SPC)
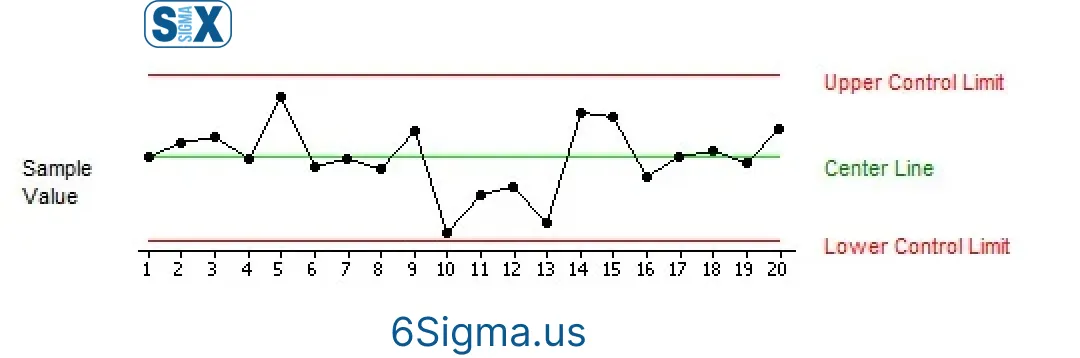
SPC techniques like control charts plot the DPMO values over different periods to visually track fluctuations in process performance. Control limits are set at +/- 3 standard deviations from the centerline.
If the DPMO data falls outside control limits or shows concerning patterns, it signals the process is unstable and interventions are required. The out-of-control signals guide improvement priorities.
As improvements are implemented, the control charts reflect gains through lower DPMO rates and data points within limits. SPC solves process issues and maintains consistency.
Control charts and monitoring process performance
Control charts with DPMO data help identify special causes versus common causes of variation. By analyzing the patterns, specific assignable root causes of quality problems can be determined versus inherent process variation.
Stratification of DPMO by product type, machine, material, etc. further pinpoints trouble areas. Real-time monitoring through statistical warnings combined with drilling down to understand flair-ups delivers sustainable defect reduction.
Thus, leveraging the Six Sigma DPMO metric within statistical process control frameworks provides the right visibility to drive process excellence.
Capability analysis to meet specifications
Process capability analysis determines if a process can meet the quality specifications necessary for customer satisfaction. It uses statistical analysis to establish acceptance criteria and assess process potential.
The defects per million opportunities (DPMO) data feeds into capability ratio metrics like Cp, Cpk, Pp, and Ppk to determine process power. For example, Cpk above 1.33 signals the process is capable of a Six Sigma rating.
If DPMO is too high and capability too low, process reengineering may be required through technology, systems, competence enhancement, etc. Capability analysis identifies sustained potential.
Case studies and examples
Leading organizations globally leverage DPMO and statistical thinking for breakthrough improvements:
- General Electric improved jet engine assembly defect rates from ~20,000 DPMO to under 10 DPMO using systematic problem-solving.
- Tata Motors passenger vehicle plant in Pune, India achieved 30% cycle time reduction and 100% model changeover through DPMO-guided cell design.
- The FDA’s Medical Device Innovation Consortium has DPMO-level quality targets for new product development pilots in healthcare.
Such success stories across manufacturing, healthcare, and services showcase the central role of defects per million opportunities metric within robust process control frameworks for managing and improving quality.
Discover advanced Six Sigma techniques and their real-world applications in our comprehensive Black Belt training.
Common Mistakes and Challenges of Six Sigma Defects Per Million
While defects per million opportunities (DPMO) provide a valuable quality metric, some common pitfalls can undermine its accuracy and effectiveness for driving process improvements. Being aware of these mistakes can help teams derive maximum value.
Sample vs population data issues
Attempting to extrapolate a sample DPMO to the entire population can be misleading if the sample is not truly representative. Small samples may be inadequate to capture potential defects across product variants, materials, machines, operators, etc.
However, measuring the entire population may be impractical. Balancing sample size and homogeneity is key along with analyzing stability using statistical confidence intervals before generalizing DPMO.
Similarly, samples should not be drawn during abnormal process conditions. This inaccurately skews the DPMO versus normal functioning. Data interpretation must factor in variability over time.
Mitigating data issues enhances the integrity of defects per million opportunities for decision-making. Supplementary metrics also add perspective for holistic understanding.
Understanding variation origins
A thorough root cause analysis must supplement DPMO reviews to grasp why defects, rework, and variability occur in the first place. Without diagnosing the source, sustainable solutions are difficult to formulate.
Some defects and causes could be training gaps, inconsistent materials, faulty equipment, unclear instructions, etc. Distinguishing between special and common causes is also imperative before proceeding.
Predicted vs empirical standard deviation
The defect rate used to calculate DPMO may rely on predicted models or empirical observations. However, statistical assumptions in predictive models may not always hold.
For example, estimating the standard deviation based on experience may understate or overstate the real-world variability. Periodic empirical data gathering is advised to validate if the DPMO based on predictive assumptions mirrors ground reality.
Analytics helps determine the most appropriate statistical distribution and methods to accurately model defects and DPMO rather than implausible approximations.
Embracing analytics minimizes the fallacies of speculative defects per million opportunities. DPMO deprives decision-makers rather than misguides them.
Importance for Driving Process Improvements
The defects per million opportunities (DPMO) metric holds invaluable significance for systematically enhancing process capabilities and output quality over time. Some key ways in which DPMO catalyzes improvement are:
- Sets Tangible Targets: The DPMO values at different sigma levels provide tangible goals for teams to aspire towards. Having quantifiable quality objectives fuels better planning and resourcing for achievements.
- Enables Benchmarking: DPMO introduces standardization which permits benchmarking across product lines, manufacturing sites, suppliers, etc. to propagate best practices. Healthy competition on metrics is motivated.
- Measures Progress: As improvement projects are rolled out, DPMO helps continually assess advancement made towards Six Sigma goals. Progress tracking prevents change initiatives from losing steam.
- Sustains Momentum: Since DPMO can be monitored over time using statistical process control, new issues are rapidly detected before escalation. This sustains momentum on enhancing process stability and building resilience.
- Identifies Priorities: DPMO trends can reveal pain points in the process that are leading to the most defects. Focusing projects on quick wins for the highest DPMO reduction gives maximum bang for the buck.
Six Sigma Defects per Million Opportunity plays an indispensable role as a change agent for steering quality improvement journeys and realizing process excellence.
Key Takeaways of Six Sigma Defects Per Million
Defects per million opportunities (DPMO) serve as a vital component of the Six Sigma methodology for quality enhancement across business processes and functions.
Some of the key lessons about effectively leveraging DPMO include:
- Standardized Metric: DPMO introduces a consistent way of measuring process capability and improvement that permits comparisons across systems, products, etc.
- Actionable Insights: By revealing shortfalls quantitatively, the defect per million metric guides quality improvement priorities through focused analytical problem-solving.
- Requires Statistical Rigor: Practitioners must apply care and statistical proficiency in sampling, computation, analysis, and interpretation of DPMO data for reliable decision-making.
- Continual Improvement: Driving processes up the sigma curve necessitates continual measurement, analysis, and improvement driven by DPMO data using methods like SPC.
- Customer Centricity: A lower DPMO denoting higher quality and consistency results in enhanced customer value and satisfaction by reducing variability and defects.
In conclusion, organizations must embrace DPMO integrated with robust statistical techniques to accelerate process excellence in today’s competitive business landscape. Mastering Six Sigma defects per million analysis fuels the journey.
Best practices for leveraging Six Sigma defects per million
Organizations aiming to deeply entrench defects per million opportunities (DPMO) analysis for catalyzing process improvements must embrace several proven practices including:
- Invest in Training: Statistically sound DPMO analysis requires competencies. Investments in orienting teams on techniques like measurement system analysis, correlation analysis, sampling, FMEA, etc. pay rich dividends.
- Voice of Customer: Keep customer needs and perspectives central to DPMO goal-setting and improvement initiative prioritization. Visit the Gemba to observe pain points.
- Rigor in Measurement: Adhere to the tightest standards possible in defective identification, counting, classification, and data capture to ensure the reliability of DPMO numbers.
- Multilayer Drill-Down: Slice and dice DPMO data across various process dimensions such as product, batch, machine, material, etc. to reveal insights.
- Cluster Analysis: Analyze patterns in DPMO data clustered by time, region, operator, etc. to diagnose if causes are sporadic or systematic.
- Integrate with Lean Six Sigma: Blend DPMO analysis with complementary LSS tools covering value stream mapping, root cause analysis, mistake proofing, etc.
Following these best practices will lead to competitive differentiation through entrenching statistical thinking and robust process control regimes fueled by the Six Sigma defects per million metric.
SixSigma.us offers both Live Virtual classes as well as Online Self-Paced training. Most option includes access to the same great Master Black Belt instructors that teach our World Class in-person sessions. Sign-up today!
Virtual Classroom Training Programs Self-Paced Online Training Programs


