All about Fault Tree Analysis
In the field of engineering, anticipating failure in projects is recognized as a showcase of an advanced process of making a product. Potential failures are to be identified before the development process initiates to successfully mitigate the risk. By doing risk management the production costs are reduced tremendously in further development. With the product being solid-proof, there is little to no chance of failure if a proper failure prevention methodology is applied.
Today, we are going to talk about one such methodology which is a part of the Six Sigma methodology — Fault Tree Analysis (FTA). As product and process technology becomes more complex, the visual FTA approach has proven to be invaluable as a stand-alone risk technique.
History of Fault Tree Analysis
Fault Tree Analysis (FTA) is a technique for reliability and safety analysis. Bell Laboratories were the first to adopt this methodology. In 1962, H.Watson of Bell Labs along with A.Mearbs were designing safeguards for the intercontinental ballistic missile (ICBM) system for the US air force called the Minuteman system. For such a complex and dangerous technology, total safety was of major concern. To improve their reliability analysis, they created the fault analysis method.
A year later (1963), Dave Haasl of Boeing Company recognized the potential of Fault Tree Analysis as a significant system for safety evaluation
What is Fault Tree Analysis?
Fault tree analysis (FTA) is a top-down detective failure analysis technique where an undesired state of a system is analyzed using Boolean logic to combine a series of lower-level elements. The technique uses a graphic model of the pathways within a system that leads to a foreseeable, undesirable loss event. It is used as a method of the root cause analysis process.
Fault tree analysis is a simpler method than Failure Mode and Effects Analysis (FMEA) because it focuses on all possible system failures caused by an undesirable event.
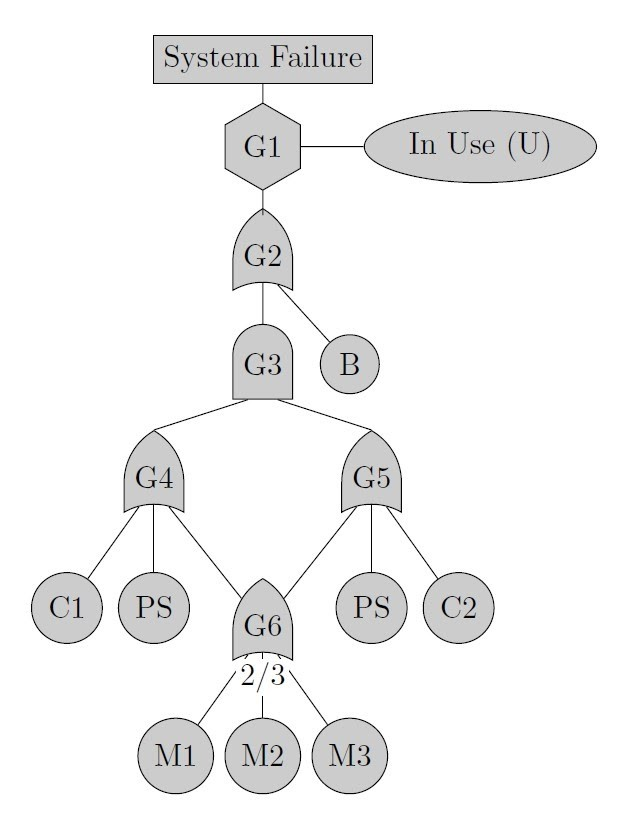
Fault Tree Diagram
A Fault Tree Diagram (FTD) are logic block diagrams that display the state of a system in the state of its components. It uses a graphic model of pathways within a system that leads to foreseeable and undesired loss events.
The pathways connect contributory events and conditions using standard logic symbols. The basic constructs in a Fault Tree Diagram (FTD) are gates and events where the events have an identical meaning as a block and the gates are the conditions.
Fault Tree Diagram Symbols
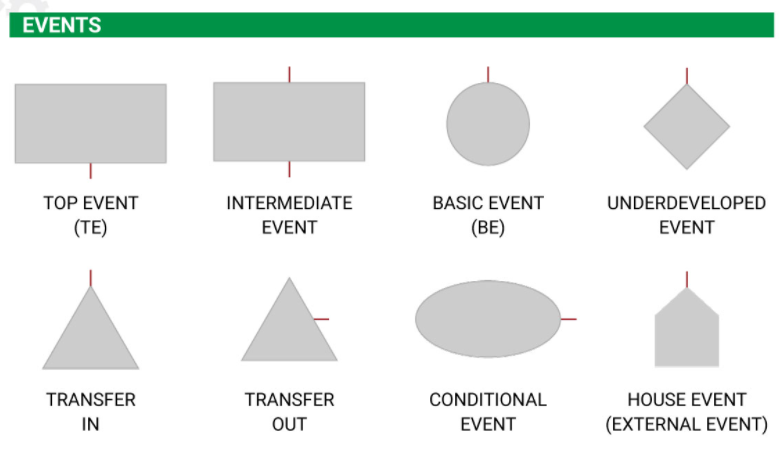
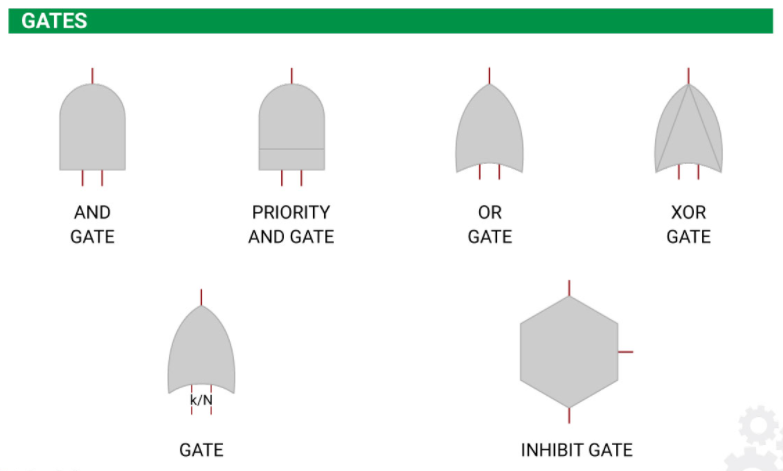
As discussed earlier, there are two types of FTD notations — events & logic gates.
The primary failure event is denoted with a circle. An external event is depicted with a symbol that looks like a house. It’s an event that is normal and guaranteed to occur. Undeveloped events denote something that needs no further investigation. A conditioning event is a restriction on a logic gate in the diagram. These gate symbols describe the Boolean relationship between the outcomes.
Gate symbols:
- OR gate – An event occurs as long as at least one of the input events takes place
- AND gate – An event occurs only if all input conditions are met
- Exclusive OR gate – An event occurs only if one of the input conditions is met, not if all conditions are met
- Priority AND gate – This is probably the most restrictive scenario when an event occurs only after a specific sequence of conditions
- Inhibit gate – An event will only occur if all input events take place as well as whatever is described in a conditional event
Identification of minimal cutsets is one of the most important qualitative analyses of a fault tree.
- Cut set: A cut set in a fault tree is a set of basic events whose (simultaneous) occurrence ensures that the TOP event occurs.
- Minimal cut set: A cut set that cannot be reduced without losing its
status as a cut set.
Steps to follow when conducting Fault Tree Analysis
Step 1: Build a diverse team
A team with a diverse set of thoughts, opinions, experience, and expertise opens up a new pathway to conducting FTA. Brainstorming sessions and meetings led by professionals along with out-of-the-box thinking from less technical knowledge members can ensure a successful FTA outcome.
Step 2: Identify failure causes
For risk management, the first objective is to identify potential failure to draw Fault Trees and FTA diagrams. It is a critical step as it dissolves the intermediate events and basic events, reverse engineering them from the top. The entire FTA process looks from the perspective of the top event and tries to gauge how that particular event could have occurred. Identifying the root cause will lead towards basic events needed to draw fault trees.
Step 3: Understand the inner workings of the system
Teams working on performing FTA needs to have a deep and thorough understanding of the inner workings of the system. A knowledgeable person in the system should be the one to lead discussions and guide the team. The goal is to get a good understanding of the requirements, connections, and dependencies of the systems.
Step 4: Draw the FTA diagram
Once the understanding of the inner system is complete, the next step that follows is to graphically present a functional map of the system using boolean logic. Using the fault tree symbols, the team can draw the graphical representation of the risk analyses system.
Step 5: Identify MCS, MPS, or CCF
After the fault trees have been created, the team can look to identify MCS, MPS, or CCF.
- MCS – minimal cut sets – are identified to know the most vulnerable parts of the system.
- MPS – minimal path set – is determined to identify the core components and subsystems required for the system to remain operational.
- CCF identifies the components that cause the maximum number of failures.
Step 6: Develop risk mitigation strategies
The components and subsystems identified after analysis should be padded. High priority should be given to protect MPS (as it will keep the system operational). Maintain schedules updates for CCFs as they can cause issues.
Benefits of Fault Tree Analysis
1) Identify failures conclusively
Using the logic of detailed failure analysis and techniques like 5 WHYs, FTA helps the team focus on the logical sequences that lead to failure.
2) Highlight important elements of system-related failures
The FTA process may lead to a single component that causes many subpaths to failure, thus improving the one element that minimizes the possibility of multiple failures
3) Gives visual aid for system analysis and management
Managers like graphics, and for a complex system, what’s better than showcasing the pain points graphically?
4) Provides alternative ways to analyze the system
Provides alternative ways to analyze the system FTA, Failure Mode Effects Analysis, RBD, and other failure analysis tools permit a way to explore system reliability. They provide a focus on failure modes one at a time. Sometimes a shift in the process illuminates new and important elements of the system.
5) Expose system behavior and possible interactions
FTA allows examination of many ways a fault may occur or the way it gets exposed on non-obvious pats.
6) Covers up human error
In the analysis, FTA includes hardware, software, and human factors. Thus, eliminating any error that resulted in the first place.
Wrapping Up!
Fault Tree Analysis is just another tool in the box for engineers. Complex systems have multiple possibilities of fault occurrence. FTA provides a great way to organize and manage the exploration of the cause. The value comes from the insights created that lead to changes, thus, avoiding and minimizing faults.
For more information, click here
SixSigma.us offers both Live Virtual classes as well as Online Self-Paced training. Most option includes access to the same great Master Black Belt instructors that teach our World Class in-person sessions. Sign-up today!
Virtual Classroom Training Programs Self-Paced Online Training Programs


