What is Ishikawa (Fishbone Diagram)?
A Math teacher once asked his pupils, “What do you think is Ishikawa?” “It is a place in Japan,” was the prompt answer of a ninth-grader. “That is interesting and quite true, but in the context of this Math class, let me help you understand that the Ishikawa I am mentioning here are diagrams that help us study ‘cause and effect’ relationships and are a useful tools for solving problems.” The pupil was red in the face and thought that he was ignorant to give that answer and figured that the teacher was not teaching them geography!
The teacher went on to explain the meaning and definition of the Ishikawa Diagram(fishbone diagram).
Introduction of Fishbone Diagram
The concept of an Ishikawa Diagram (fishbone diagram) was pioneered by Kaoru Ishikawa, who contributed to the concept of Quality Management in Japan. In order to understand the importance or rationale of the Ishikawa Diagram (Fishbone Diagram), it is a good idea to investigate what Quality Management is. Managing and maintaining quality of products and services is Quality Management. The seven famous quality tools proposed by him were: control chart, run chart, histogram, scatter diagram, Pareto chart, Ishikawa diagram, and flowchart.
Definition of Ishikawa Diagram (Fishbone Diagram)
An Ishikawa diagram basically helps in understanding the ‘cause and effect’ relationship for solving a problem. It is a very helpful tool as it gives a pictorial representation of what is the cause of a problem or a phenomenon, what factors have a high/low impact to those problems/phenomena and how can the situation be resolved. The Ishikawa is drawn like a fishbone and helps a person to ‘see’ the causes and effects in a particular relationship. Obviously, demarcating solutions from problems is not an easy task. Let us take a look at the following two situations for understanding the need to have ‘pictures’ to solve a problem.
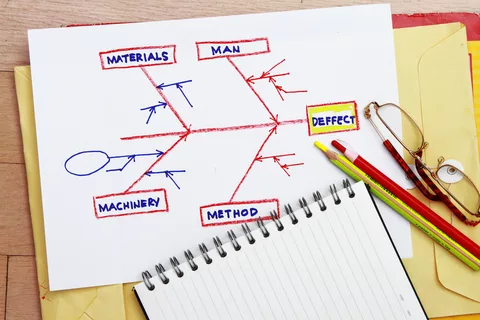
ID 18191455 | Fishbone Diagram © Ragsac19 | Dreamstime.com
Two Hypothetical Examples
Often, planning a party looks like an easy job. I have often heard people say,” How hard can it be to have a party?” Selecting a venue, making a guest list, planning food, working out the party themes, decorations, preparing goodie bags are just a few things that come to mind. It looks very straightforward and you do not realize the details unless you are fully involved in the process. If something goes wrong at that party, you keep wondering about the causes: Was it the food? Was it the venue? Was it the weather? Was it about party games? Was it some other reason?
Another situation is related to a newspaper publisher. He notices that 3 of his major accounts (Car manufacturers), have stopped advertising with his paper. He is concerned about it and thinks randomly about the causes of this problem. Is his newspaper unable to give value to these Car manufacturers? Is his newspaper unable to reach to the target audience that wants to buy new cars? Are the competitors offering very low prices for placing advertisements in their newspapers? Is the quality of his paper declining in terms of editorial content, readership and promptness of reporting?
Click here to know more about Root Cause Analysis
In both the above situations, there are some similarities. There is a cause and there is an effect. To deal with the effects, it is important to have a holistic knowledge of all the contributing causes. An Ishikawa diagram helps (see picture above) to understand the complex inter-relationships of various contributing factors towards an issue/problem, as in the case of the newspaper publisher discussed above.
The Ishikawa diagram looks like a fishbone, and is popularly known as the ‘Fishbone Diagram’. Ideally, an Ishikawa diagram has an oval/rectangular box at the right-hand side. This box is labeled with the problem to be studied/effect. There is a horizontal line (which can be visualized as the backbone) and a number of ‘bones’ (read causes) stemming from it. There is a label for each one of these, and these are on the left-hand side of the diagram. Each cause may have several contributing causes and these are marked by smaller lines. The graphical ease of Ishikawa Diagrams has made them very popular in analyzing day-to-day problems and significant variances across industries.
Contact us at 6Sigma.us and find out how we can positively help you plan and change the culture and operations of your organization. We offer Six Sigma White Belt, Six Sigma Yellow Belt, Six Sigma Jump Start, Six Sigma Green Belt and Six Sigma Black Belt training programs.
SixSigma.us offers both Live Virtual classes as well as Online Self-Paced training. Most option includes access to the same great Master Black Belt instructors that teach our World Class in-person sessions. Sign-up today!
Virtual Classroom Training Programs Self-Paced Online Training Programs


