What Are Common Root Cause Analysis (RCA) Tools?
What is Root Cause Analysis?
When you encounter a problem, it is always advisable to get to the bottom of it as quickly as possible. In the business environment, the Root Cause Analysis (RCA) is a technique that allows people to determine the reasons why a particular problem has occurred.
This technique identifies the source of the problem using precise steps and tools so that necessary steps can be taken in the future to avoid the problem from happening again. The root cause analysis is done in a systematic way.
It involves different steps such as describing the existing problem, collecting the necessary data linked with the problem, identifying possible causes, identifying causes that need to be addressed to prevent the problem from recurring, identifying solutions, implementing changes, and observing the changes.
Six sigma certification enables employees to learn these complex steps and master root cause analysis to identify organizational problems.
Root Cause Analysis (RCA) for Beginners
This particular tool can analyze a particular system at once. This is often used in complicated systems when multiple problems exist, and it is important to immediately get to the root cause of the problem.
The current reality tree is created by listing all the undesirable events and problems observed in a particular process.
Once every undesirable event or problem is listed down, finding the link using languages like “if” and “then” follows to depict the possible cause of the problem.
Learn more about Root Cause Analysis training and check out the current training schedule to enroll right away!
Root Cause Analysis (RCA) Training
There are many Root Cause Analysis tools that are used to conduct RCA, and these Root Cause Analysis tools help one determine the root cause of the problem.
Below are the different Root Cause Analysis methods used in conducting RCA
1) 5 Whys Analysis
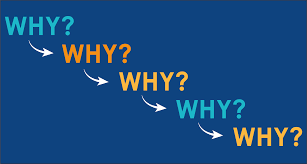
This technique is used to get to the bottom of the root cause of the problem. By asking the question “Why?” five times, you can delve deeper into the problem and find that the answers to the questions are interrelated. You can create a clearer picture and strategically identify the real cause of the problem.
The 5 Whys technique is often introduced in Six Sigma Green Belt certification programs, making it an ideal starting point for professionals new to structured problem-solving.
2) Failure Mode and Effects Analysis (FMEA)
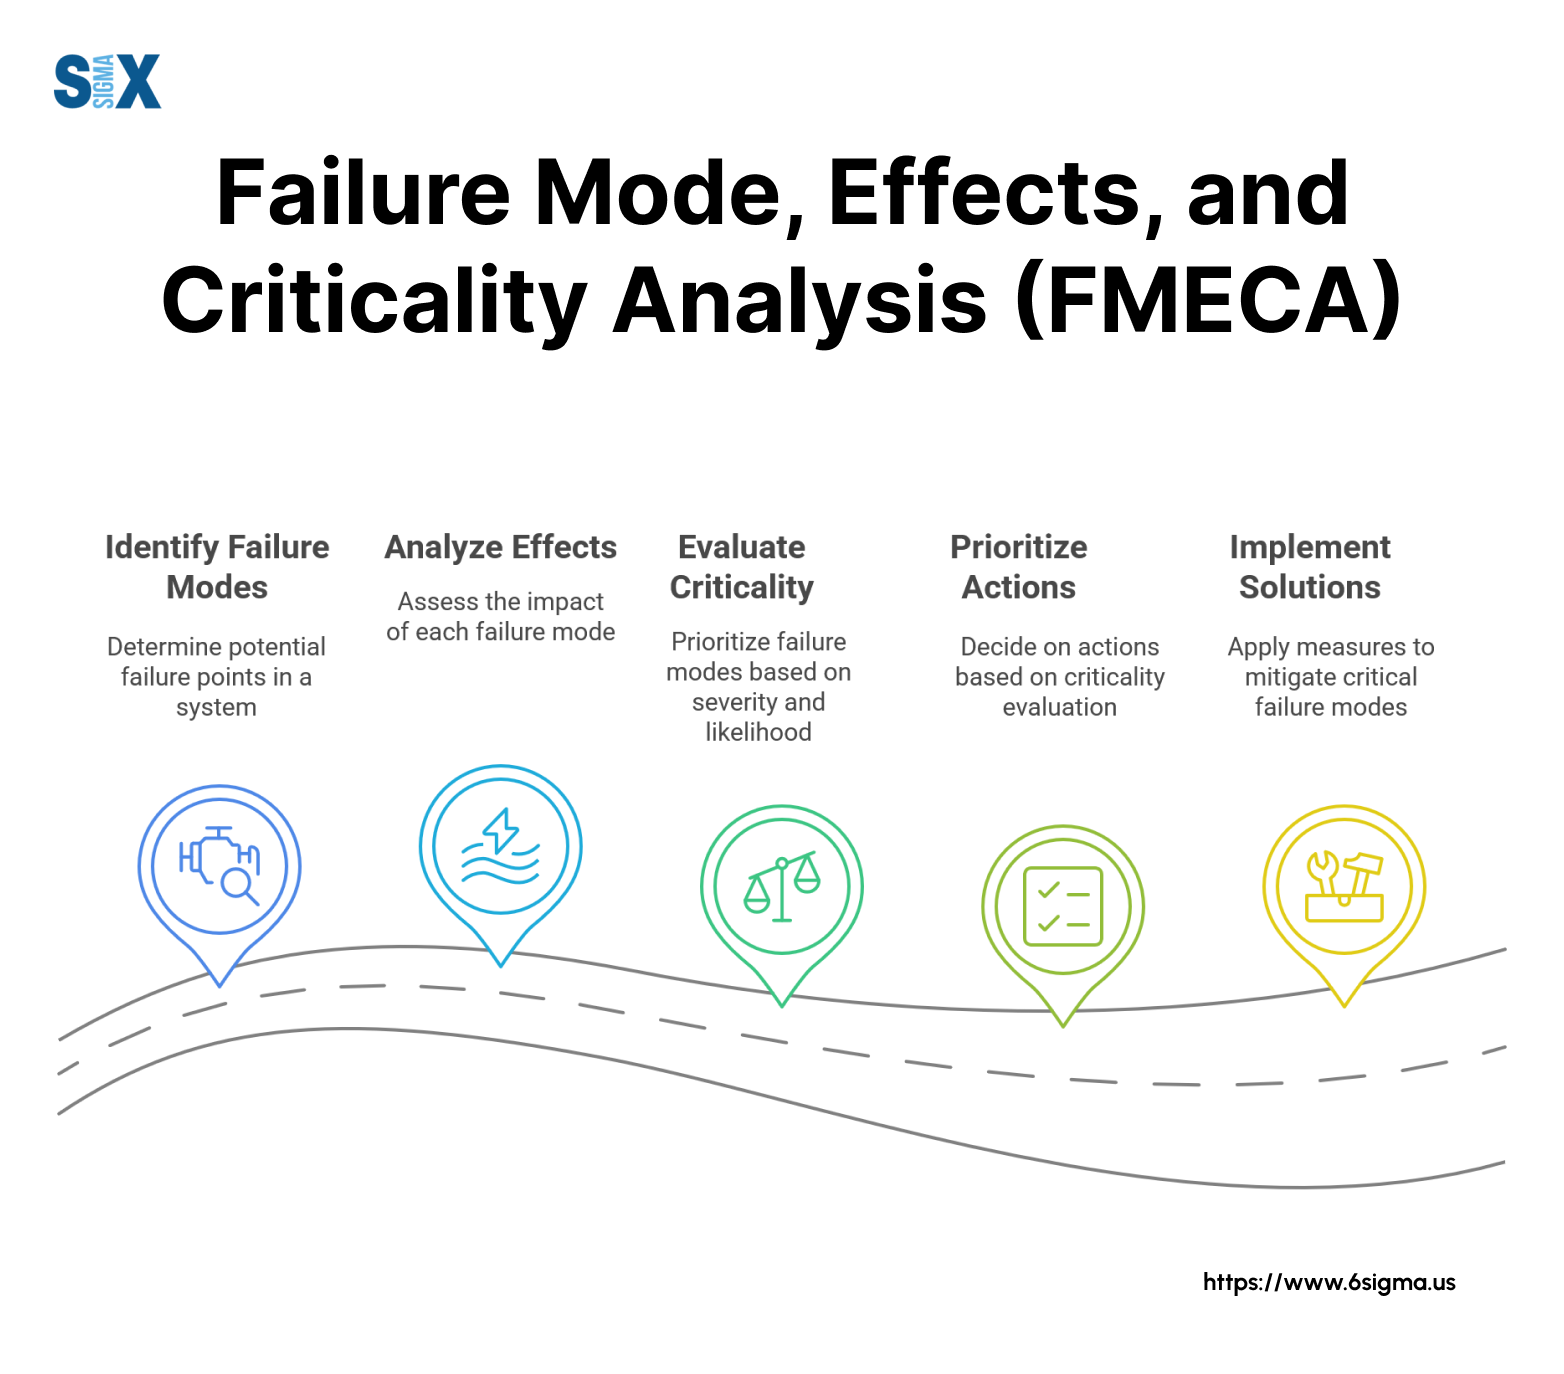
The failure mode and effects analysis (FMEA) is a technique that is used to determine the failures within a particular system. A lot of companies use this RCA tool to find out which parts of the processes are faulty so that they can be corrected. It also determines the number of times the failure occurs, the actions implemented by the organization to prevent the failure from recurring, and determining areas, where actions taken, were effective. This tool is often done every time a new process or product is generated.
Earn a Free Failure Mode and Effects Analysis Certificate
3) Fault Tree Analysis
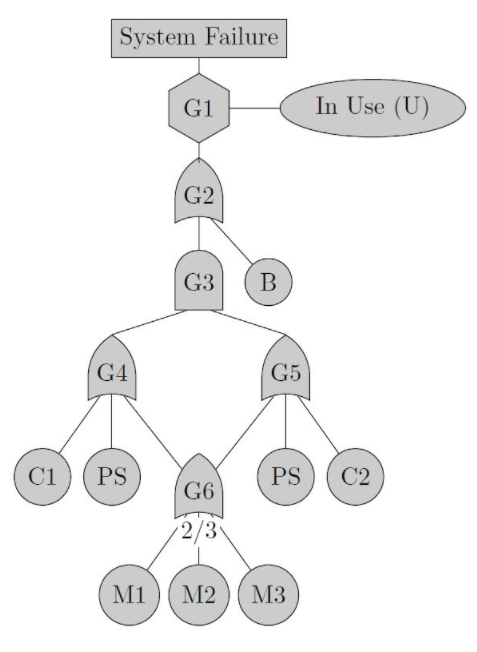
The fault tree analysis is another method of determining the root cause of a particular problem. It uses Boolean logic to determine the cause of the problem in any undesirable event. As the name implies, this tool involves creating a diagram that looks like trees where all potential causes are written down as branches.
Check our Root Cause Analysis (RCA) Training
4) Fishbone Diagram
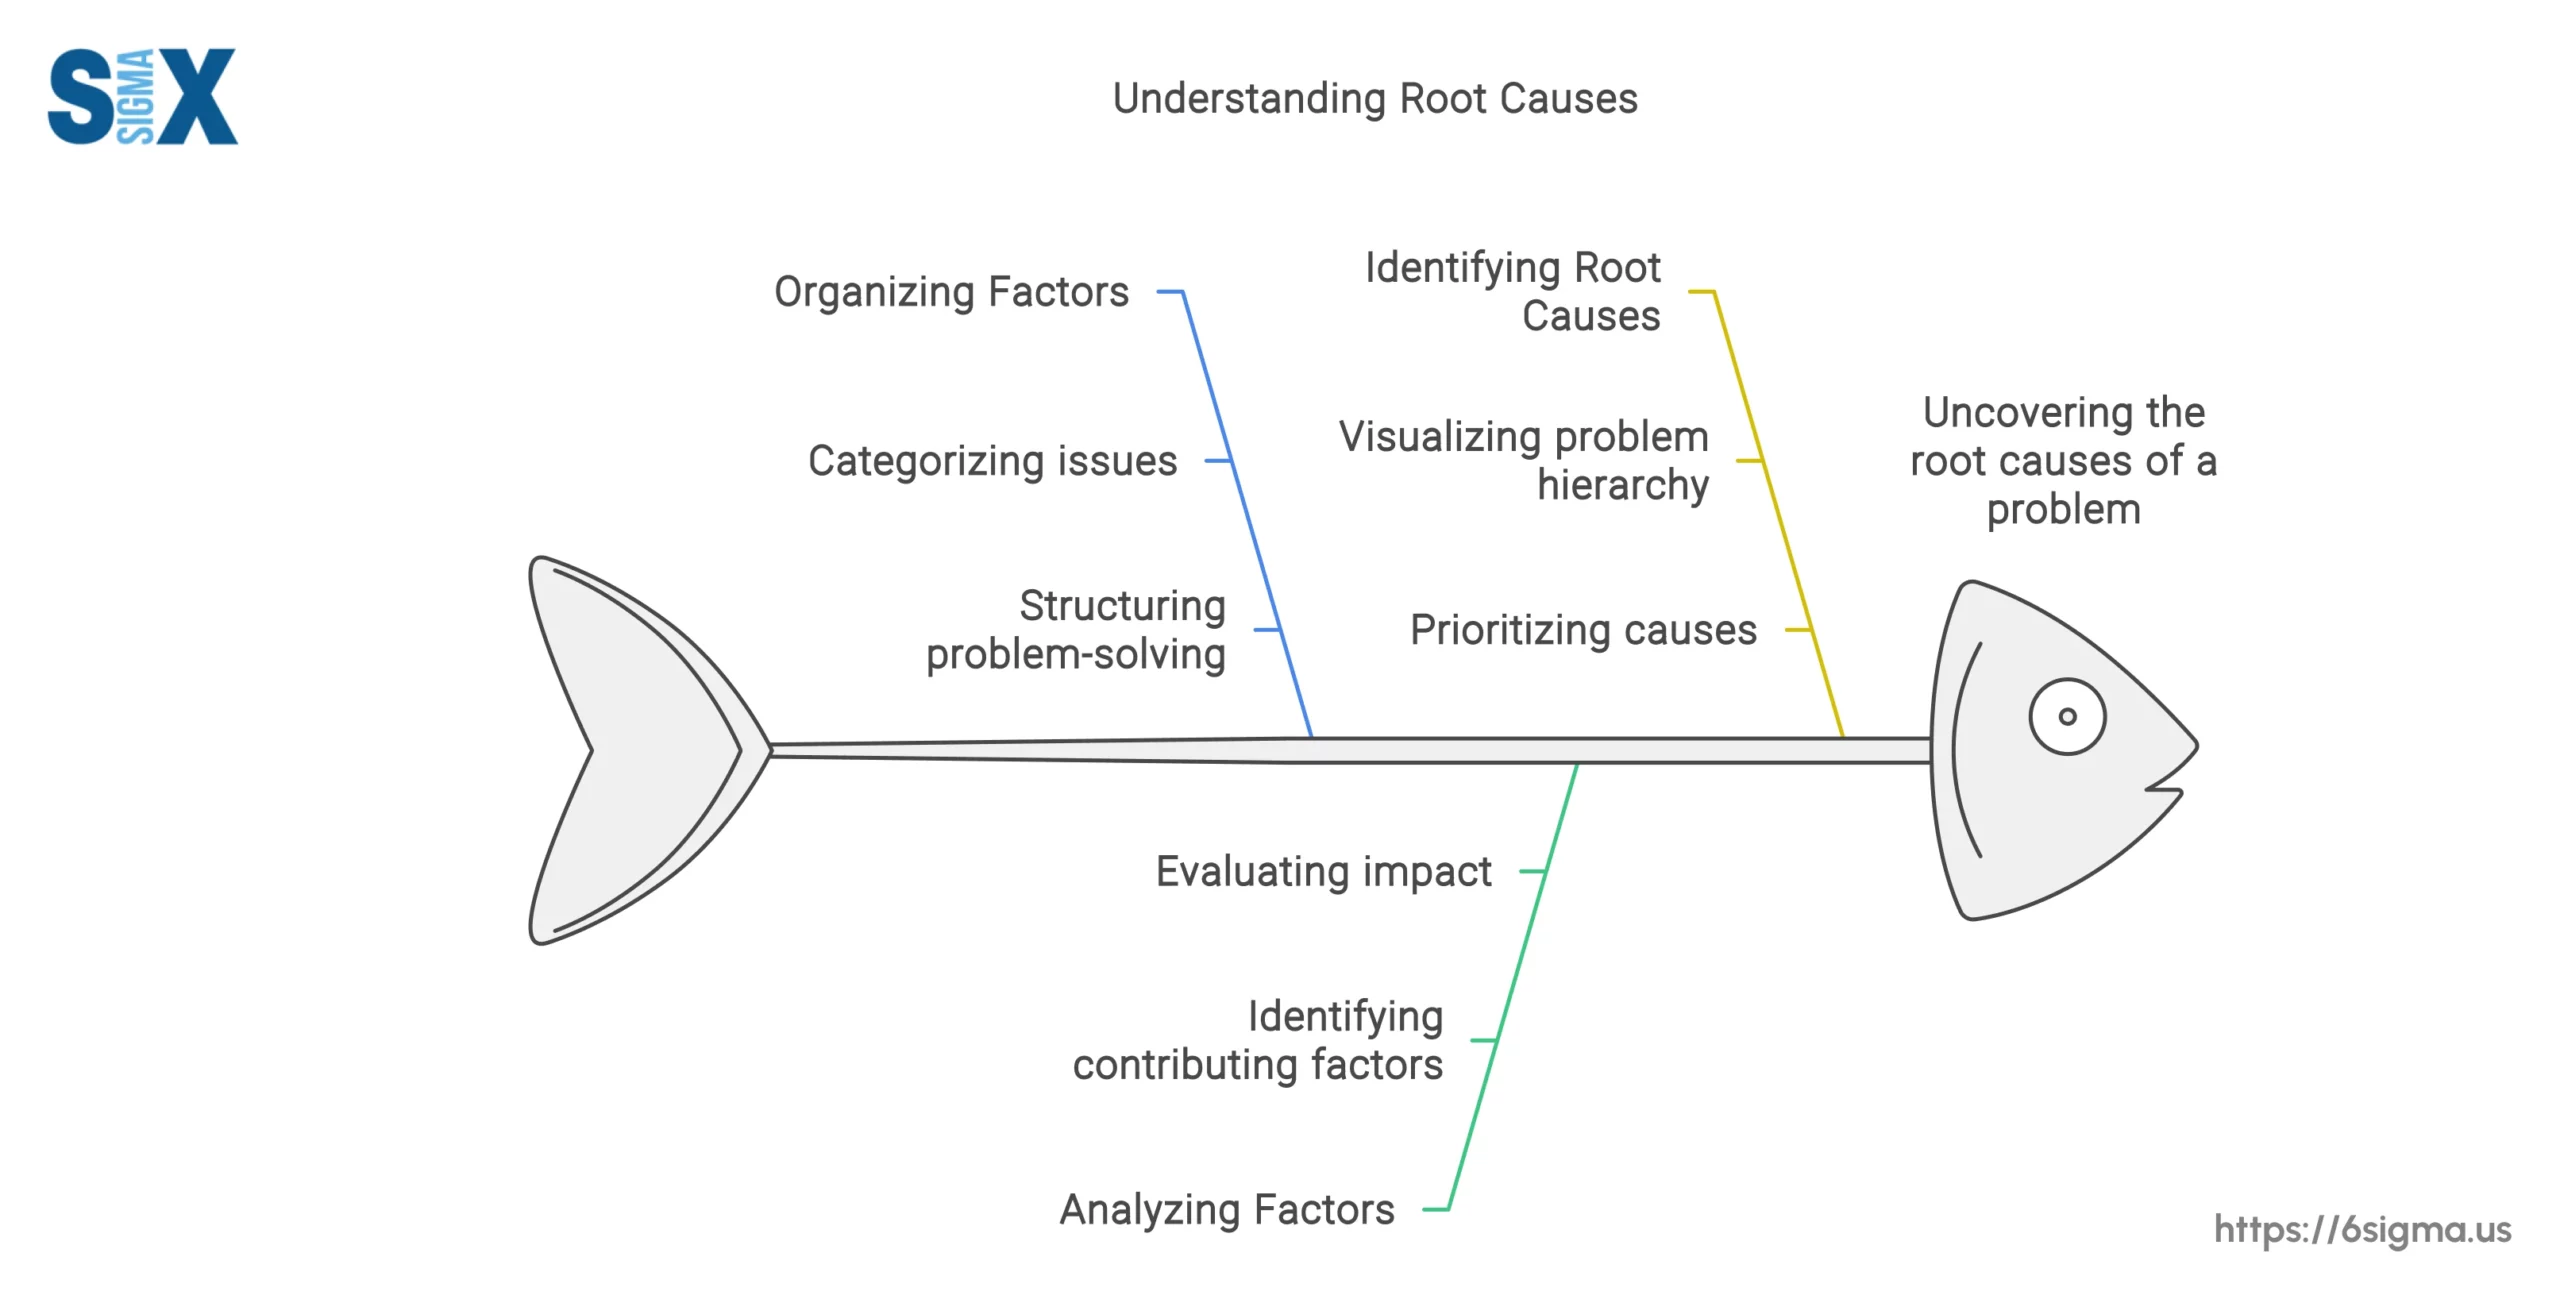
Also called the Ishikawa diagram, a fishbone diagram is a useful tool in conducting root cause analysis. Similar to the fault tree diagram, it is named after its shape–a fishbone–and is used to group causes into different sub-categories like methods, measurements, materials and many others for easier determination of the cause.
5) Pareto Charts
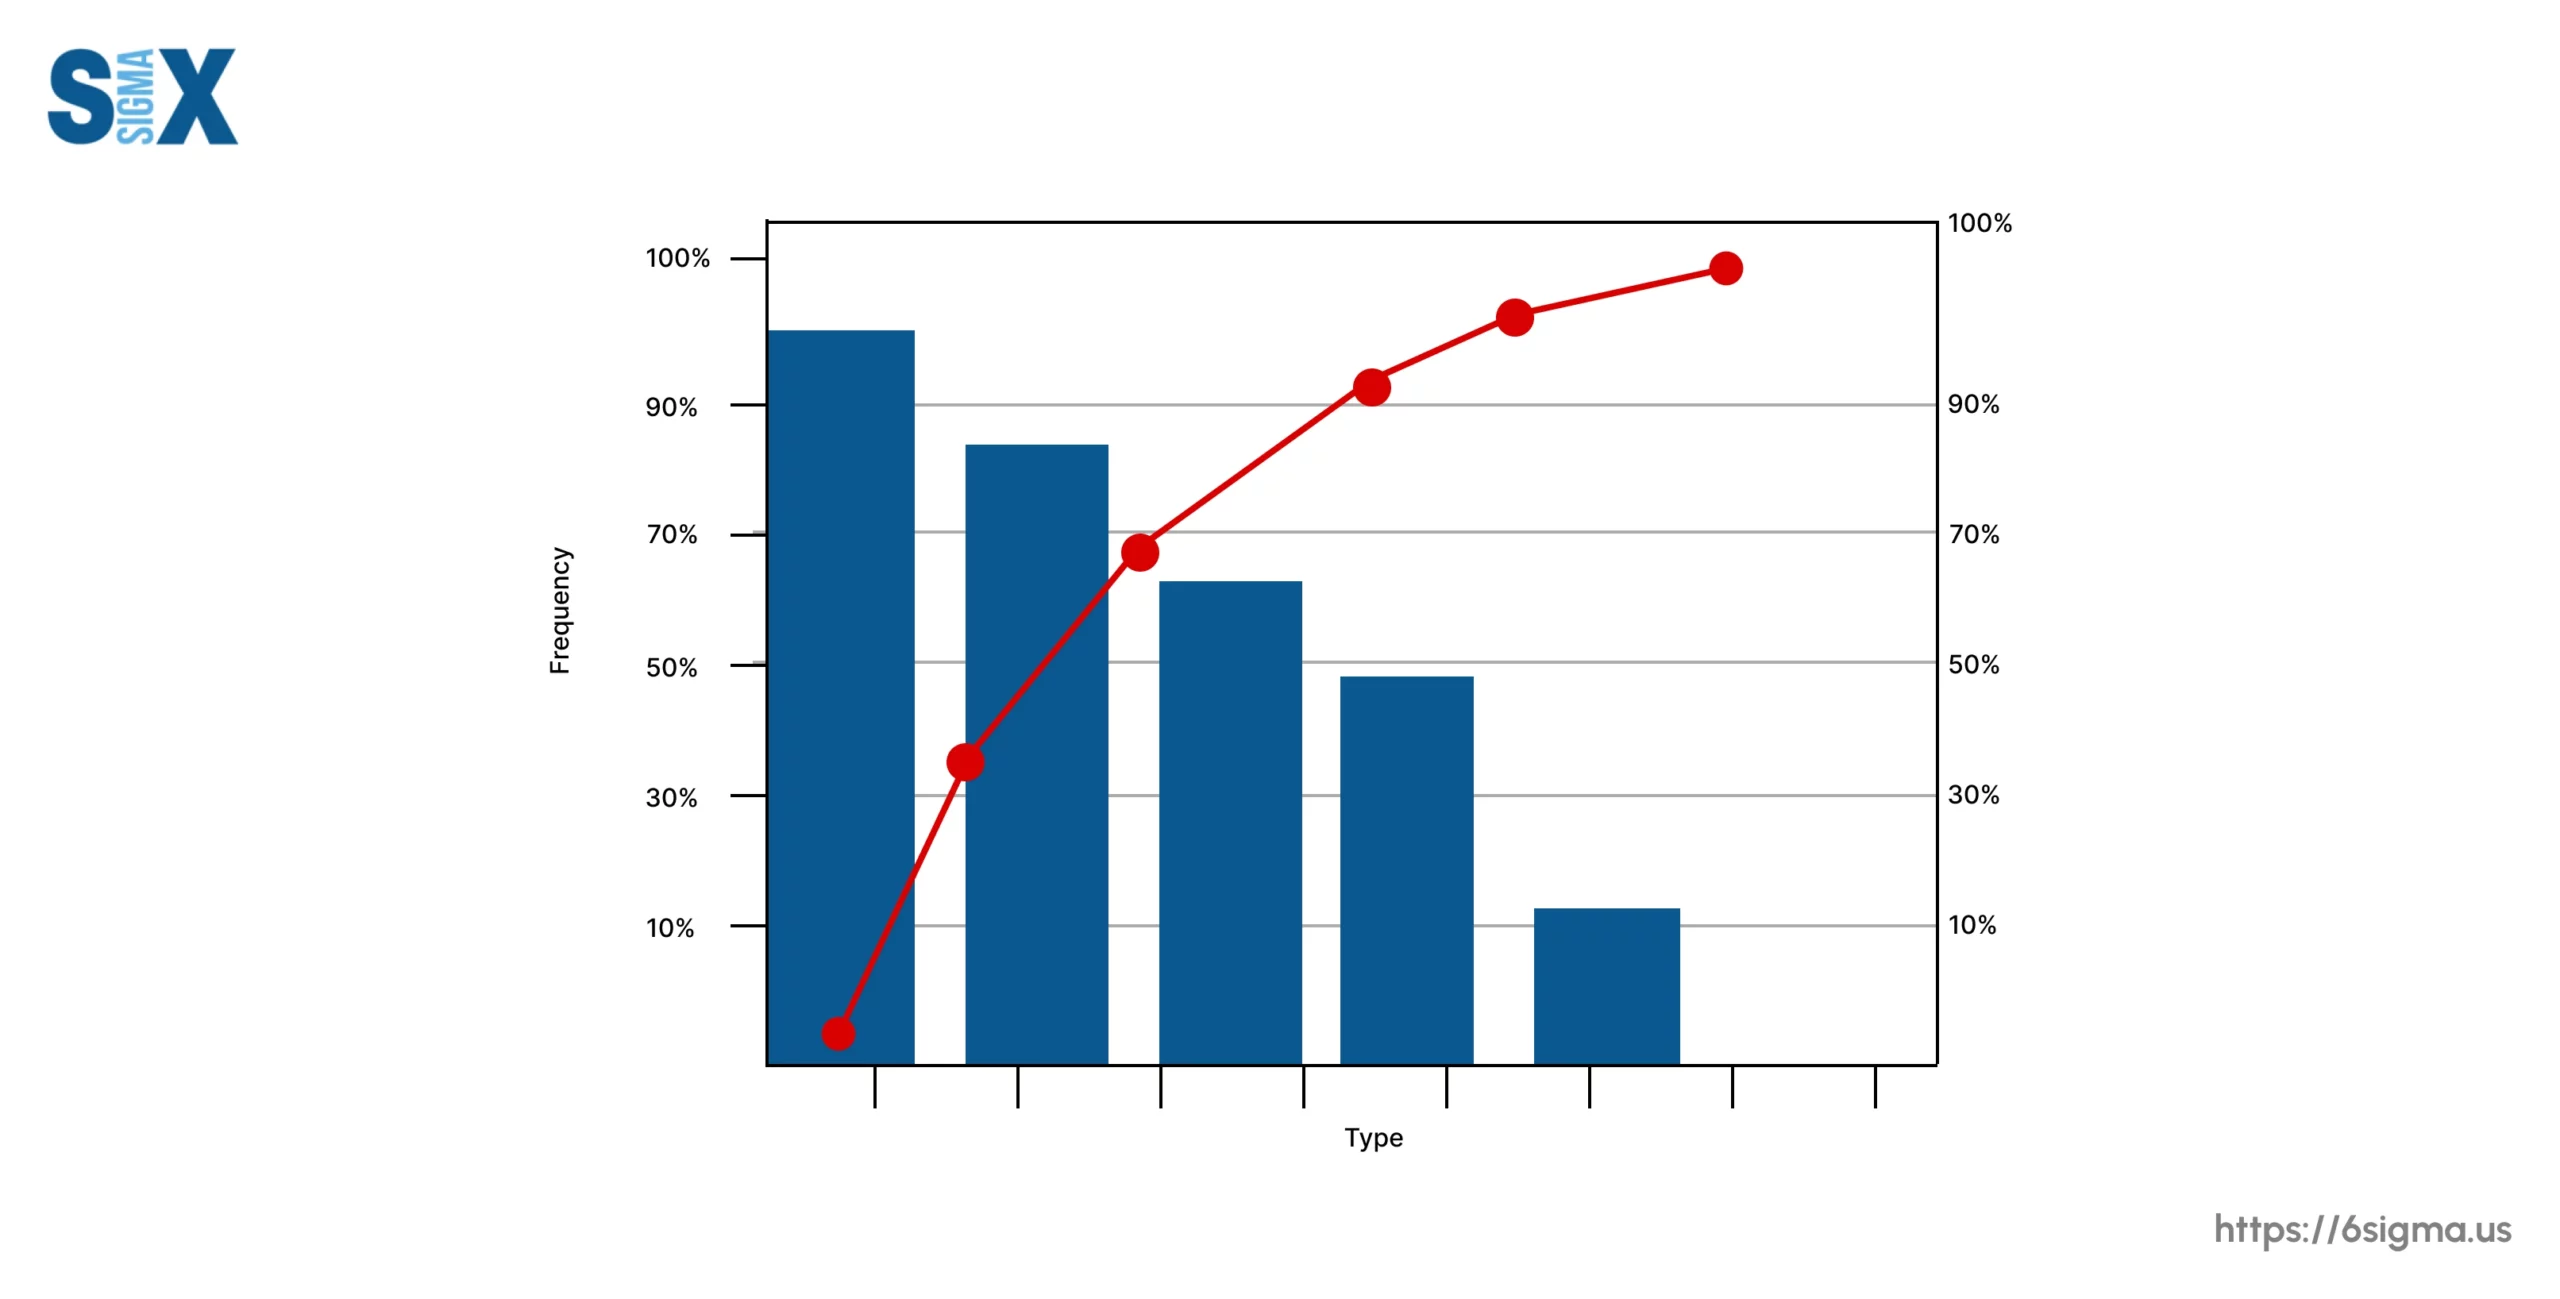
Developed by Vilfredo Pareto (an Italian economist in the 1900s), a Pareto diagram is a simple bar chart that ranks related measures in decreasing order of occurrence. The purpose of a Pareto diagram is to segregate trivial and significant problems. By graphically separating the aspects of a problem, teams will know where to direct the improvement efforts. In the diagram, the larger the bar is reduced, the more the improvement.
6) Scatter Plot Diagram
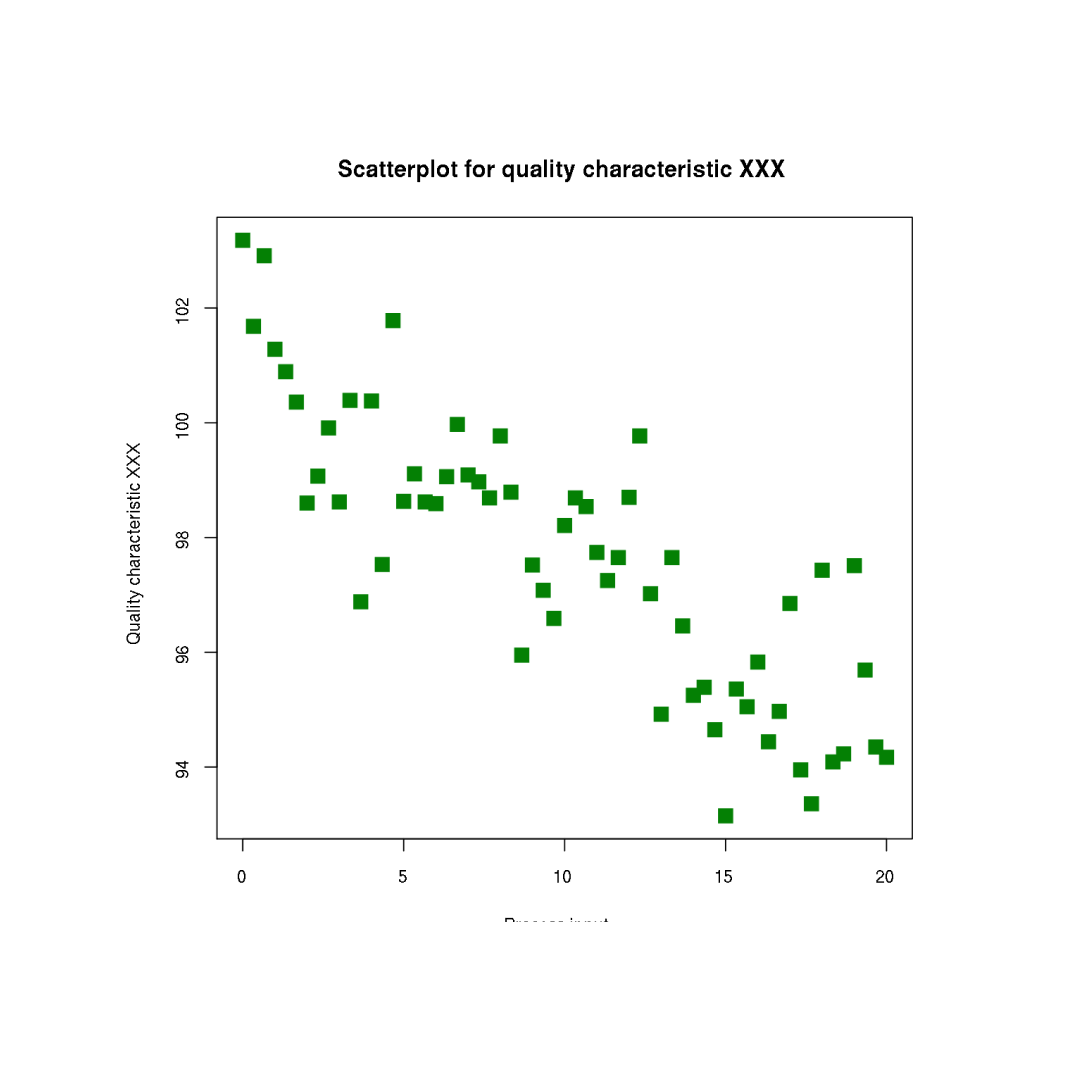
A scatter plot (also known as a scatter chart/scatter graph) uses dots to represent the values of two different numeric variables. The position of each dot on the horizontal and vertical axis indicates values for an individual data point. Scatter plots are used to observe relationships between variables.
Summary
The root cause analysis is a very helpful process in understanding as well as finding solutions to the problem. These indispensable tools will help you conduct this process more efficiently.
Stop by and contact us at 6Sigma.us and find out how we can positively help you plan and change the culture and operations of your organization. We offer Lean Six Sigma Green Belt and Lean Six Sigma Black Belt training programs, as well as a Master Black Belt program.
SixSigma.us offers both Live Virtual classes as well as Online Self-Paced training. Most option includes access to the same great Master Black Belt instructors that teach our World Class in-person sessions. Sign-up today!
Virtual Classroom Training Programs Self-Paced Online Training Programs