Multi-Vari Chart: Powerful Tools for Process Analysis and Improvement
One of the most flexible and revealing tools in the Six Sigma toolbox is the multi-vari chart. This graphical method lets you see and study the different causes of variation in a process.
The multi-vari chart is a handy diagnostic that helps pinpoint and fix the root sources of process inconsistencies.
This article will give you the know-how to correctly build, read, and use multi-vari charts to your advantage. You’ll gain the skills needed to analyze processes and fuel continual upgrades.
Let’s jump in and explore how multi-vari charts work their magic. I’ll show you how to construct them, decipher what they’re revealing, and leverage their insights to transform your business.
Key Highlights
- Understand the fundamentals of multi-vari charts, including their definition, benefits, and applications across various industries.
- Learn the step-by-step process of creating multi-vari charts, from collecting data and determining factors and levels to manual construction and software-based approaches.
- Gain insights into interpreting multi-vari charts, analyzing within-piece, piece-to-piece, and time-to-time variations.
- Explore case studies that illustrate the practical application of multi-vari charts in manufacturing process optimization, quality control, and root cause analysis.
- Discover best practices for using multi-vari charts effectively.
- Understand the role of multi-vari charts in Six Sigma and Lean Six Sigma methodologies.
- Address common questions, compare multi-vari charts with other graphical techniques, and learn how to avoid common pitfalls.
What is a Multi-Vari Chart?
In the process improvement and Six Sigma methodologies, the multi-vari chart stands as a powerful diagnostic tool that enables us to visualize and analyze the sources of variation in a process.
Definition of Multi-Vari Chart
A multi-vari chart is a graphical representation that illustrates the relationship between factors (input variables) and a response (output variable) in a process.
It is a two-dimensional chart where time is plotted on the horizontal axis, and the process output measurement is plotted on the vertical axis.
The chart is designed to display three distinct sources of variation: within-piece variation (positional), piece-to-piece variation (cyclical), and time-to-time variation (temporal).
Benefits of Using Multi-Vari Charts
1. Visualize Multiple Sources of Variation
One of the primary advantages of multi-vari charts is their ability to simultaneously visualize and analyze three distinct types of variation within a single graphical representation.
This comprehensive view allows for a more holistic understanding of the process and the factors contributing to its variability.
2. Identify Root Causes Quickly
By examining the magnitude of variation across different sources (positional, cyclical, and temporal), multi-vari charts can provide valuable clues about the potential root causes of process variation.
This visual analysis can significantly accelerate the root cause identification process, leading to more targeted and effective improvement efforts.
3. Simplicity and Accessibility
Multi-vari charts can be constructed manually, making them accessible to operators and frontline personnel. This hands-on approach fosters engagement and ownership among those directly involved in the process, enhancing their understanding and commitment to the improvement efforts.
Applications of Multi-Vari Charts
Multi-vari charts have widely applied across various industries and processes, including manufacturing, healthcare, finance, and service operations.
They are treasured in situations where multiple factors influence a critical process output, and identifying the sources of variation is crucial for process optimization and quality improvement. Some specific applications of multi-vari charts include:
1. Manufacturing Process Optimization
In manufacturing environments, multi-vari charts can be used to analyze variations in critical product characteristics, such as dimensions, strength, or performance metrics.
By identifying the sources of variation, manufacturers can implement targeted process improvements to enhance product quality and consistency.
2. Quality Control and Assurance
Multi-vari charts are valuable tools in quality control and assurance initiatives.
They can help identify sources of variation that impact product or service quality, enabling organizations to take corrective actions and maintain high standards of quality.
3. Root Cause Analysis
In problem-solving and root cause analysis efforts, multi-vari charts serve as powerful diagnostic tools.
They can provide insights into the underlying causes of process variations, guiding teams towards effective solutions and preventing the recurrence of issues.
How to Create a Multi-Vari Chart
Creating a multi-vari chart is a straightforward process that can be accomplished both manually and with the aid of statistical software.
However, before diving into the construction methods, it is essential to understand the key components and data requirements for effective multi-vari chart creation.
Factors and Levels in Multi-Vari Charts
Multi-vari charts are designed to analyze the relationship between factors (input variables) and a response (output variable).
Factors can be any process parameter or condition that may influence the output, such as machine settings, operator techniques, environmental conditions, or material characteristics.
Each factor can have multiple levels, which represent the different values or settings that the factor can take.
For example, if we are analyzing the impact of three machines on a particular output, the “machine” factor would have three levels (Machine 1, Machine 2, and Machine 3).
It is generally recommended to limit the number of factors to a maximum of six to maintain the interpretability and clarity of the multi-vari chart.
Additionally, each factor should have at least two levels to enable the analysis of variation.
Collecting Data for Multi-Vari Chart
Effective multi-vari chart creation relies on the collection of high-quality data that accurately represents the process being studied. Here are some key considerations for data collection:
Sample Size
Determine an appropriate sample size that captures the inherent variation in the process. Typically, a minimum of three consecutive units or samples is recommended for each factor combination, but more may be needed depending on the process’s complexity and variability.
Measurement Procedure
Establish a consistent and standardized measurement procedure to ensure data integrity and reliability.
This may involve the use of calibrated measurement instruments, proper sampling techniques, and adherence to standard operating procedures.
Data Organization
Organize the collected data in a structured manner, typically in a tabular format. This will facilitate the construction of the multi-vari chart and ensure that all relevant factors and levels are properly represented.
Manual Construction of Multi-Vari Chart
While statistical software can streamline the creation of multi-vari charts, it is valuable to understand the manual construction process, as it can provide deeper insights into the underlying principles and foster a better understanding of the tool.
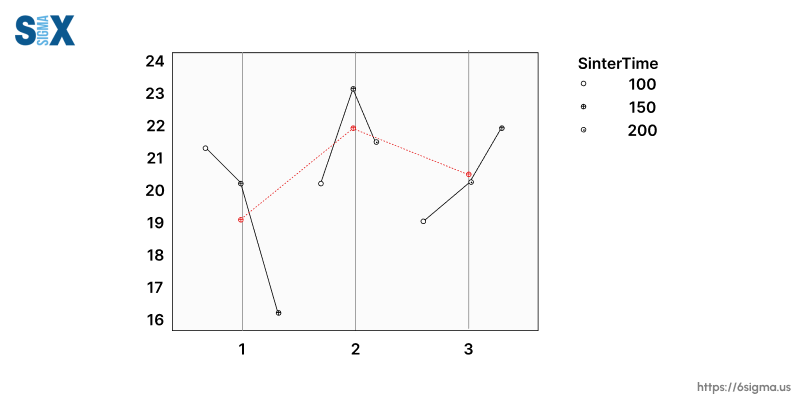
Plot the Measurements
On a two-dimensional graph, plot the individual measurements for each unit or sample, using a consistent symbol or color to represent each measurement within the unit. Connect these measurements with a solid line to illustrate the within-piece variation.
Calculate and Plot Unit Averages
Calculate the average value for each unit or sample and plot these averages using a different symbol or color. Connect the unit averages with a long-dashed line to represent the piece-to-piece variation.
Determine and Plot Overall Averages
Calculate the overall average for each set of consecutive units or samples and plot these averages using a distinct symbol or color. Connect the overall averages with a short-dashed line to represent the time-to-time variation.
Indicate Time Breaks
Use vertical lines or other visual cues to indicate breaks in time or shifts between sets of consecutive units or samples.
Creating Multi-Vari Charts with Software
While manual construction can be valuable for understanding the principles of multi-vari charts, statistical software can significantly streamline the process and provide additional analytical capabilities. Two commonly used software tools for creating multi-vari charts are:
Excel
Microsoft Excel, with its powerful charting and data analysis capabilities, can be used to create multi-vari charts. Third-party add-ins or macros may be required to automate the chart creation process and incorporate advanced features.
Minitab
Minitab is a comprehensive statistical software package that includes dedicated tools for creating multi-vari charts. Its user-friendly interface and specialized features make it a popular choice among Six Sigma practitioners and quality professionals.
Regardless of the software used, the key steps involved in creating a multi-vari chart remain similar: importing or entering the data, selecting the appropriate chart type, specifying the factors and response variable, and adjusting the chart settings and formatting as needed.
Interpreting a Multi-Vari Chart
Once a multi-vari chart has been constructed, the next crucial step is to interpret the graphical representation effectively.
By analyzing the patterns and variations displayed in the chart, valuable insights can be gained regarding the sources of process variation and potential areas for improvement.
Analyzing Within-Piece Variation
Within-piece variation, also known as positional variation, refers to the variability observed within a single unit or sample. This type of variation can be visually assessed by examining the spread or range of the individual measurements plotted for each unit.
A larger spread or range of measurements within a unit indicates a higher degree of within-piece variation, which may be attributed to factors such as inconsistent measurement techniques, non-uniform material properties, or localized process variations.
By analyzing the within-piece variation, you can identify potential issues related to measurement processes, operator techniques, or inherent material or product characteristics that may require attention.
Analyzing Piece-to-Piece Variation
Piece-to-piece variation, also known as cyclical variation, represents the variability observed between consecutive units or samples. This type of variation can be evaluated by examining the pattern and magnitude of the long-dashed line connecting the unit averages.
A more erratic or fluctuating pattern of the long-dashed line indicates higher piece-to-piece variation, which may be attributed to factors such as machine settings, tooling conditions, or batch-to-batch variations in raw materials or processes.
By identifying and addressing the sources of piece-to-piece variation, you can improve the consistency and reproducibility of your process, leading to higher product or service quality and reduced waste or rework.
Analyzing Time-to-Time Variation
Time-to-time variation, also known as temporal variation, refers to the variability observed over longer periods of time or across different production runs or shifts. This type of variation can be assessed by examining the pattern and magnitude of the short-dashed line connecting the overall averages.
A more pronounced or fluctuating pattern of the short-dashed line indicates higher time-to-time variation, which may be attributed to factors such as environmental conditions (temperature, humidity), equipment wear and tear, or changes in personnel or operating procedures.
By addressing the sources of time-to-time variation, you can enhance the long-term stability and robustness of your process, ensuring consistent performance and quality over extended periods.
Identifying Interactions and Root Causes
While analyzing the individual sources of variation is crucial, it is also important to consider potential interactions between factors. Interactions occur when the effect of one factor on the process output depends on the level of another factor.
Multi-vari charts can provide visual cues about potential interactions by revealing patterns or trends that deviate from the expected behavior.
For example, if the within-piece variation increases or decreases systematically over time, it may indicate an interaction between positional and temporal factors.
By identifying these interactions, you can gain deeper insights into the root causes of process variation and develop more comprehensive and effective solutions.
It is essential to complement the visual analysis of multi-vari charts with statistical techniques, such as Analysis of Variance (ANOVA), to quantify the significance of main effects and interactions.
Case Studies of Multi-Vari Chart
To illustrate the practical application and power of multi-vari charts, let’s explore some real-world examples and case studies from various industries.
These scenarios will demonstrate how multi-vari charts can be used to identify sources of variation, pinpoint root causes, and drive process improvements.
Manufacturing Process Optimization
In a manufacturing facility producing automotive components, engineers were tasked with reducing the variability in the dimensional tolerances of a critical part.
By constructing a multi-vari chart, they were able to visualize the sources of variation in the production process.
The multi-vari chart revealed that the most significant source of variation was piece-to-piece, with the long-dashed line connecting unit averages displaying a highly erratic pattern. Further investigation revealed that the root cause was related to inconsistent machine settings and tooling wear.
Armed with this information, the engineers implemented preventive maintenance schedules, standardized machine setup procedures, and introduced statistical process control (SPC) monitoring.
As a result, the piece-to-piece variation was significantly reduced, leading to improved product quality and reduced scrap rates.
Quality Control in Baking
In a commercial bakery, maintaining consistent product quality was a top priority. However, the bakery was experiencing significant variation in the width of cookies, leading to customer complaints and potential waste.
To identify the sources of variation, a multi-vari study was conducted, and a multi-vari chart was constructed. The chart revealed that the most significant source of variation was within-piece, with a large spread of measurements observed for individual cookie sheets.
Further investigation traced the root cause to temperature inconsistencies within the ovens, as well as variations in the placement of cookies on the baking sheets.
Frequently Asked Questions about Multi-Vari Charts
As with any powerful tool, multi-vari charts can raise questions and concerns, particularly for those new to the technique or encountering specific challenges in their application.
Advantages
Visual Representation: Multi-vari charts provide a clear and intuitive visual representation of process variation, making it easier to identify patterns and potential sources of variation.
Comprehensive Analysis: By simultaneously displaying within-piece, piece-to-piece, and time-to-time variations, multi-vari charts offer a holistic view of the process, enabling a more thorough analysis.
Accessibility: Multi-vari charts can be constructed manually, making them accessible to operators and frontline personnel, fostering engagement and ownership in improvement efforts.
Diagnostic Capabilities: Multi-vari charts serve as powerful diagnostic tools, providing valuable clues about potential root causes and guiding further analysis and investigation.
Disadvantages
Interpretation Challenges: While the visual representation is intuitive, interpreting multi-vari charts and identifying patterns can be challenging, especially for complex processes or when interactions are present.
Limited Statistical Rigor: Multi-vari charts are graphical representations and do not provide statistical measures of significance. They should be complemented with statistical techniques like ANOVA for a more rigorous analysis.
Data Requirements: Constructing accurate multi-vari charts requires sufficient data collection, which can be time-consuming and resource-intensive, especially for processes with high variability or numerous factors.
Potential Limitations: Multi-vari charts may not be suitable for certain types of data or situations where the assumptions underlying their construction are violated (e.g., non-normal distributions, non-continuous data).
While multi-vari charts are powerful tools, they are not the only graphical techniques available for process analysis and improvement. It is important to understand how multi-vari charts compare to other commonly used graphical methods, such as scatter plots and histograms.
Scatter Plots
Scatter plots are useful for visualizing the relationship between two continuous variables, such as a process input and output.
They can help identify potential correlations or patterns but do not provide insights into the sources of variation within the process.
In contrast, multi-vari charts are designed to analyze the relationship between multiple factors and a single response variable, while simultaneously visualizing different sources of variation (within-piece, piece-to-piece, and time-to-time).
Histograms
Histograms are graphical representations of the distribution of a single continuous variable, such as a process output. They can provide insights into the central tendency, spread, and shape of the distribution but do not directly reveal the sources of variation or the impact of multiple factors.
Multi-vari charts, on the other hand, are specifically designed to analyze the impact of multiple factors on a single response variable and identify the sources of variation within the process.
While scatter plots and histograms can provide valuable information, multi-vari charts offer a more comprehensive and diagnostic approach to process analysis, particularly when multiple factors are involved and understanding the sources of variation is critical for process improvement.
Despite their effectiveness, multi-vari chart analysis is not without potential pitfalls and common mistakes that can lead to erroneous conclusions or ineffective improvement efforts.
Ignoring Measurement System Variation
Failing to validate the measurement system and account for potential measurement variation can lead to inaccurate multi-vari chart interpretations and misguided improvement efforts.
Insufficient Data Collection
Inadequate sample sizes or insufficient time intervals can result in incomplete or inaccurate representations of the process variation, leading to incorrect conclusions and suboptimal solutions.
Overlooking Interactions
While multi-vari charts can provide visual cues about potential interactions between factors, overlooking or failing to investigate these interactions can result in an incomplete understanding of the root causes and ineffective improvement strategies.
Overreliance on Visual Interpretation
While the visual representation of multi-vari charts is intuitive, overreliance on visual interpretation without complementary statistical analysis can lead to subjective conclusions and potentially miss significant effects or interactions.
Lack of Process Knowledge
Effective multi-vari chart analysis requires a deep understanding of the process being studied. Lack of process knowledge can lead to incorrect assumptions, misinterpretations, and ineffective improvement efforts.
To mitigate these pitfalls, it is crucial to follow best practices, such as conducting thorough measurement system analyses, collecting sufficient data, and incorporating statistical techniques.
SixSigma.us offers both Live Virtual classes as well as Online Self-Paced training. Most option includes access to the same great Master Black Belt instructors that teach our World Class in-person sessions. Sign-up today!
Virtual Classroom Training Programs Self-Paced Online Training Programs


