Organizing Information With An Affinity Diagram
Problem-solving in an organization requires collaborative brainstorming. Team members must collaborate to create solutions to pressing issues; an affinity diagram helps them do this effectively. This article will explain affinity diagrams and how to organize information with them.
What is an affinity diagram?
An affinity diagram is a business tool for organizing ideas and data. It helps teams organize many ideas into natural relationships to extract practical insights. It lets users organize massive volumes of information into distinct clusters, enabling them to understand it better.
Jiro Kawakita, a Japanese anthropologist, created the affinity diagram in the 1960s. That’s why affinity diagrams are fondly called the KJ method.
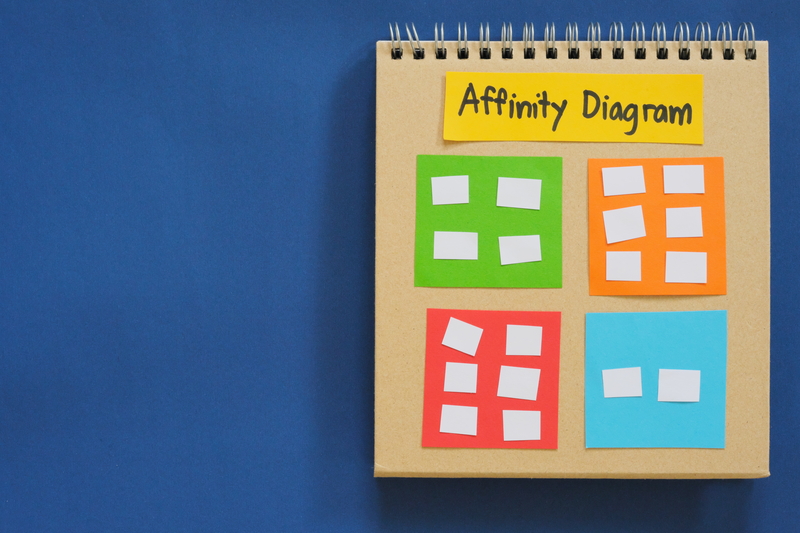
The idea of an affinity diagram is to organize information into related categories to make it easy to analyze. The above sample picture has three segments (from left to right):
- The first is the organization’s KPIs.
- The second is the organization’s KPIs grouped by similarities.
- The third is an affinity diagram with all the KPIs clearly labeled according to their similarities.
You can observe that the affinity diagram has made it easier for anyone to look at the KPIs and understand what they’re about. Compare that to the first segment, where random KPIs are listed with no coherence.
Learn more about our Six Sigma training.
How to create an affinity diagram
Below are the steps for creating an affinity diagram:
1. Choose a topic
The first step is to clarify the topic that needs to be organized. The pictorial example in this article concerns KPIs, but the topic could be anything. For instance, it can be ideas for a new product, ideas to improve an existing product, or identifying issues with a business process.
2. Brainstorm
Team members should hold a brainstorming session to gather information. Everyone should share their idea, and any worthwhile idea should be added as an entry in the affinity diagram.
For example, if your team is brainstorming about a new product, you can write down every valuable idea on a sticky note and place them on a (physical or virtual) whiteboard.
3. Grouping
Categorize the sticky notes according to logical relationships. For instance, when brainstorming product ideas, you can group ideas according to the amount of working hours required to implement them: “1 week,” “1 month,” “2 months,” “3 months,” “1 year,” etc. Each group must have a distinct name.
4. Prioritization
Sort the groups based on priority, using distinct colors to indicate priority levels. For example, red can represent high priority, yellow for mid-priority, and green for low priority.
Final Words
An affinity diagram helps teams sort through large volumes of information, making it easier to understand. We’ve explained affinity diagrams and how to create one to organize ideas. Follow our tips, and you shouldn’t have issues creating effective affinity diagrams.
SixSigma.us offers both Live Virtual classes as well as Online Self-Paced training. Most option includes access to the same great Master Black Belt instructors that teach our World Class in-person sessions. Sign-up today!
Virtual Classroom Training Programs Self-Paced Online Training Programs