Two Sample T-Hypothesis Test and its importance in Six Sigma
We cannot undermine the contribution of statistics in successful Six Sigma projects. In this article, we will discuss one of the most commonly used statistical tests in the Six Sigma – Two Sample T-Hypothesis Test.
The Two-sample T-test compares the average difference between the two groups. It helps us understand if there is some significance between the two sample groups or if it is just a random chance.
You must think about the real-world application and use-case of this test? Well, Two-sample T-tests help you answer questions like whether the success rate is higher after implementing a new sales tool. Are the results of patients better who received a drug than those who received a placebo? You can apply these tests to your Six Sigma project in any domain or field!
Why Two Sample T-tests?
We use this test to measure if two group samples are statistically independent of each other. This test enables us to establish if the two population means are equal or not.
There are two types of Two Sample T-Hypothesis tests:
- Equal Variance: The two populations share equal variances
- Unequal Variance: The two populations share unequal variances
Before we go ahead with Two sample T-Hypothesis Test
Now, the question is how do you determine if the population variance of the sample is equal or not?
To get this answer, we use an F-test.
An F-test measures the equality of variance between two normally distributed populations. F-test is popularly known for testing of equal variance between two normally distributed populations. The F-test is very sensitive to non-normality.
So, when any of the two populations is not normal, we use the Brown-Forsythe test. Brown-Forsythe test helps us to test the equality of the two variances.
When the populations are normally distributed, we use different tests to compare the means of the two independent groups. This will tell us if we can go ahead with our two-sample t-test or not. We do this by:
- Student’s t-test: This test compares the means of two sample groups’ data, which is taken from independent populations. Remember, for Student’s T-test there is an assumption that both the populations from which sample data is taken have a normal distribution and both their variances are the same.
- Welch’s t-test: This test compares the means of two sample groups’ data, which is taken from independent populations. Remember, for Welch’s T-test there is an assumption that both the populations from which sample data is taken have a normal distribution, but it does not take into an assumption that both the populations share the same variance.
So, Welch’s test is the best to use when the two samples do not have equal variance.
Now the question you might ask is what if the variance of the two sample groups are not the same. How do we determine whether they are equal or not?
How to determine if the two samples have equal variance?
- Variance Rule of Thumb
The rule of thumb assumes that if the ratio of the larger variance to the smaller one is less than 4. Then the variance of the two samples is approximately equal. And then we can use the Student’s T-test to get further into completing our Two Sample T-Hypothesis Test.
Example:
Sample 1 has variance = 28.92
Sample 2 has variance = 18.93
Now, compute the ratio of the larger variance to the smaller variance.
Ratio = 28.92 / 18.93 = 1.527
Since, after calculation, we get the result that the ratio is less than 4, we can assume that the variance of the two groups of samples is approximately equal.
Now, since we have established the variances of the two samples are equal, we can go ahead with the Student’s t-test to test if the two groups share the same mean or not.
- Perform an F-test
An F-test is another statistical test that checks the equality of variances between two groups. The tests use two types of hypothesis:
H0: Samples have equal variances, i.e., σ12 = σ22
HA: Samples do not have equal variances, i.e., σ12 ≠ σ22
F is the test statistic, and it is calculated by:
F = S12 / S22
where S12 and S22 are the sample variances.
After calculating the above, we get a p-value. We will compare the p-value corresponding to the test statistic, and if the test statistic is less than the significance level (here 0.05). Then, with sufficient evidence, we can conclude that both the samples do not have equal variance.
We will be using the same values, where Sample 1 has a variance of 28.92 and Sample 2 has a variance of 18.93. The sample size of both samples is 11. The significance level (α) is 0.05.
To perform an F-test on these two samples, we will calculate the test statistic – F. We do this by:
=> F = S12 / S22
=> F = 28.92 / 18.93
Fcalculated = 1.527
Now, we will need to compute the p-value. This is done by referring to an f-table. But the calculation is not complete, as you will need a sample size. As both the samples have 11 units, we will calculate the Degree of Freedom for both the samples. The calculation is as follows:
DF1 = n1 – 1
DF1 => 11-1 = 10
The same is followed for calculating DF2
DF2 = n2 -1
DF2 => 11-1 = 10
Now, using the f-distribution calculator we compute p-value for DF1 = 10, and DF2 = 10, we get p-value = 0.257699.
Since the computed p-value is not less than 1.527, we fail to reject the null hypothesis. In other words, we can assume the sample variances are equal.
Thus, we will go forth with Student’s T-test to determine if the two groups have the same mean.
Two Sample T-Hypothesis Test
Now, we know how to test for the equal variance of two populations. We can go ahead with our core test, i.e., Two-sample T-Hypothesis Tests.
Let’s first get to know the hypothesis that we will be testing for:
- Null Hypothesis (H0): μ1 = μ2
- Alternate Hypothesis (HA): μ1 ≠ μ2
μ1 is the mean of population 1, and μ2 is the mean of population 2
Assumptions of a Two-sample T-test
- Samples from the two populations are unbiased.
- Both the sample sizes are continuous and their variances are unknown.
- The samples taken should be independent of each other.
- The two sample sizes must be less than 30.
- The samples collected from the population are normally distributed.
- The Null Hypothesis is rejected if the test statistic value is less than or equal to the critical value.
Calculating Two Sample T-Hypothesis Test
In this test, we compare two sample means to check if they come from the same population (which means there’s no difference between the two population means). Now, the question before us is whether the two populations are the same, i.e, μ1 = μ2 or not.
The first step is to obtain the SE (Standard Error) means from the sampling distribution of the two sample means. The standard error of a statistic is the standard deviation of its sampling distribution or an estimate of that standard deviation.
Also, since we don’t know the population standard deviation of the two populations, the SE means must be estimated.

Note: The above formula is applicable for a sample size of less than 30.
Sp is a pooled estimate of the common population standard deviation. Thus, we can safely assume that the variances of the samples are equal for both populations. This is where the Student’s and Welch’s tests come into the picture. But, we can also use statistical software(s).
The software would help us calculate even if the variances are unequal. Although, the actual calculations are complex and much beyond the scope of this article. This is where Minitab comes in and aids you with every calculation you need for your Six Sigma project.
Let’s take an example to calculate the two-sample t-test:
N Mean Standard Deviation
Sample A 12 96 13
Sample B 13 88 15
Ho: “The population means are the same, i.e., μ1 = μ2 or μ1 – μ2 = 0
HA: “The population means are not the same, i.e., μ1 ≠ μ2 or μ1 – μ2 ≠ 0
α = 0.05
Now,
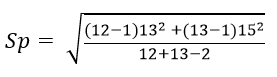
= 14.078
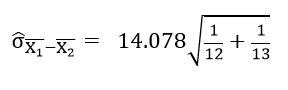
= 5.6312
In the two-sample t-test, the t-statistics are retrieved by the subtraction of the difference between the two sample means from the null hypothesis, i.e., μ1 – μ2 = 0.
Now,

= 1.4206
Looking up the t-table, we can find the value of t-critical. We can do the same via using excel or any other software that you use. The value of t-critical from the table shared is 2.06. If the t-calculated (standardized difference between the two samples) is larger than 2.06 or smaller than -2.06, we can conclude that there is a significant difference between the two population means.
But, 1.4206 is less than 2.06; thus, it is true. So, we cannot reject the null hypothesis, which means that H0 holds. And we can say that the two-sample population means are approximately equal.
Conclusion
In this article, we learned about the two-sample t-hypothesis test, and how it is applied in the Six Sigma process. Using this statistical test we can understand the difference between two products. Like, we can understand if the new product is better than the previous one, or if it just looks better.
As we know the use cases of Six Sigma do not pertain to a single industry or domain. Thus, you can apply it right at your workplace without any changes in the theory or applications.
SixSigma.us offers both Live Virtual classes as well as Online Self-Paced training. Most option includes access to the same great Master Black Belt instructors that teach our World Class in-person sessions. Sign-up today!
Virtual Classroom Training Programs Self-Paced Online Training Programs


