Find Your Flow: Process Flow Diagrams for Beginners
What is Process Flow Diagram?
A Process Flow Diagram is a graphical tool depicting the steps of a process in a serial order. The intrinsic reason behind it is to include all of the steps that are critical to the process. Flow diagrams are used by the team to visualize the process, and often annotate it with performance information.
You can use Process flow diagrams in just about any industry to organize process steps in sequential order. The process flow diagram is incredibly useful tools in Six Sigma and Lean, as they allow you to arrange data in a detailed, comprehensive manner by which to easily identify areas where corrective action is needed. This article will breakdown all the important facts about process flow diagrams, as well as how to build one for your use.
When is a Process Flow Diagram Necessary?
It’s important to understand just when and where you should employ a process flow diagram, as they are not always necessary. You can use a flow diagram for the manufacturing process, any administration processes, and service processes, as well as for project plans. Below is a list of key situations where a process flow diagram is most effective:
- If you want to understand how a process works.
- To study a process in detail so that you can improve it.
- If you need to convey to others how a process functions.
- To resolve communication difficulties when multiple people are working on the same process.
- To document how a process works.
- When you are planning a project.
How to Build a Process Flow Diagram
Process flow charts are simple and effective plans that can help resolve a lot of process improvement issues with very little work. They can be designed on a computer, on paper, or on a whiteboard using whatever tools you want. For those with Six Sigma training, you may have experience of building diagrams like this. Below is a basic procedure for how to design your own process flow diagram:
- Define the process. Simply write the title at the top of the chart area. Again, this can be either on a computer, paper, or a whiteboard. You can do this alone or as a group.
- Discuss the boundaries. Answer the following: Where and when does the process begin and end? Is it a basic outline of the procedure, or is it a complicated, in-depth analysis of the process?
- Look at the process stages that take place and write them down. This can be on sticky notes, cards, or text boxes/shapes on your computer.
- Put them in order. Now you can work together if in a group, to place them in sequence. Consider which stages rely on others to take effect when putting the activities in order. Identify processes that are fundamental, as well as those that are less important, if not redundant.
- Use arrows to show the direction of flow. This is where you will link each stage, showing where the process diagram begins, ends, and everything in between.
- Review the process. Work with your group and those involved in the relevant process (i.e. supervisors, workers, suppliers, customers) to assess the diagram. If working alone, show your work to someone else who is knowledgeable about the subject. This ensures all information displayed is accurate and valid.
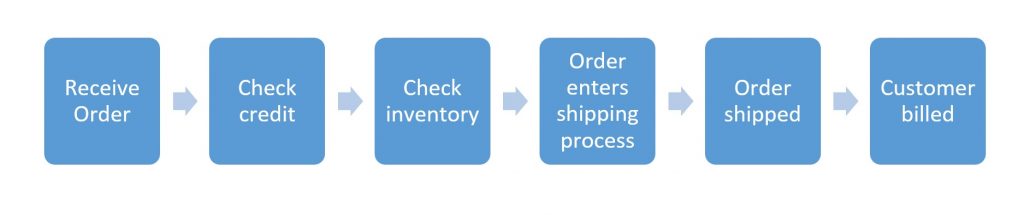
Example Process Flow Diagram
Below is a basic diagram, which can be used for simple processes that don’t possess complicated procedures. This basic design can be modified as you wish for diagrams that require more in-depth presentations of data.
Process flow diagram in Six Sigma
SixSigma.us offers both Live Virtual classes as well as Online Self-Paced training. Most option includes access to the same great Master Black Belt instructors that teach our World Class in-person sessions. Sign-up today!
Virtual Classroom Training Programs Self-Paced Online Training Programs


