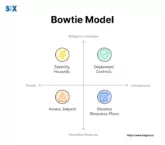
Articles

Image: What is Overall Equipment Effectiveness (OEE)

The Ultimate Guide to Overall Equipment Effectiveness (OEE): Mastering Calculation, Implementation, and Optimization

Efficiency isn’t just a goal—it’s a necessity for survival and growth. This is where Overall Equipment Effectiveness (OEE) comes into play, serving as the gold standard for measuring productivity and identifying opportunities for improvement in your operations. Key Highlights We’ll dive deep into the world of Overall Equipment Effectiveness (OEE), covering everything from basics to […]

View More

Image: Standard Deviation of Sampling Distribution

The Definitive Guide to Standard Deviation of Sampling Distribution

You’re a researcher charged with making critical decisions that could impact millions of lives, but you’re blindfolded, left to stumble in the dark. Sound daunting? That’s exactly the predicament you face without a firm grasp of sampling distributions and their standard deviations. These fundamental statistical concepts illuminate the path, transforming educated guesses into accurate inferences […]

View More

Image: Genchi Genbutsu

Genchi Genbutsu: A Way to First-Hand Process Observation

Imagine you’re a business leader faced with a persistent operational issue that’s hurting productivity and customer satisfaction. You’ve pored over reports, analyzed data, and held countless meetings, yet the root cause remains elusive. This disconnect between perception and reality is a common challenge that the Japanese philosophy of “genchi genbutsu” can help overcome. Genchi genbutsu, […]

View More

Image: 8 Pillars of TPM

The Key to Unstoppable Operations: Mastering the 8 Pillars of TPM

Every business strives for efficient, streamlined operations. However, inefficient equipment and unplanned downtime can quickly derail productivity and profitability. That’s where the pillars of TPM (Total Productive Maintenance) become invaluable. This lean methodology empowers organizations to achieve the ambitious yet attainable goals of zero breakdowns, zero defects, and zero accidents. TPM revolves around 8 fundamental […]

View More

Image: Scrum Board

What is a Scrum Board? A Comprehensive Guide to Agile Project Management

Agile project management has become necessary in organizations that want to move fast, iterate faster, stay competitive, and drive growth. Scrum boards are one crucial component that powers teams to drive efficiency, transparency, and collaboration, ultimately driving projects to success. What is a Scrum Board? Scrum board aka Agile scrum board is a management tool […]

View More

Image: Lean Problem Solving

Lean Problem Solving Techniques. The Definitive Guide to Operational Excellence

In today’s fast-paced business world, efficiency isn’t just an advantage — it’s a necessity. This powerful methodology isn’t just a tool; it’s the secret weapon that sets successful companies apart from their competitors. Whether you’re a seasoned business professional, a project manager looking to streamline operations, or a process improvement enthusiast eager to make a […]

View More

Image: Cycle Time vs Lead Time

The Definitive Guide to Cycle Time vs Lead Time

Efficiency and optimization are the names of the game. Whether you’re a manufacturer striving to streamline production or a project manager aiming to deliver on time, understanding metrics like cycle time vs lead time can be game-changers. But what exactly are cycle time and lead time? Cycle time measures the duration to complete one cycle […]

View More

Image: Quality Inspection

The Ultimate Guide to Quality Inspection in Manufacturing

Delivering consistent product quality is an absolute necessity – not an option. A single defective item can severely tarnish a brand’s reputation and erode hard-earned customer trust. This is where the vital significance of quality inspection comes into play – a meticulous process that acts as the gatekeeper for product excellence. Key Highlights Mastering the […]

View More

Image: Unimodal Distribution

Unimodal Distribution: A Comprehensive Guide with Interactive Tools

In data analysis, understanding statistical distributions is crucial, a unimodal distribution is a probability distribution with a single peak or mode. But there’s so much more to discover. Key Highlights Understanding Unimodal Distribution What is a unimodal distribution? At its core, a unimodal distribution is a probability distribution with a single peak or mode. This […]

View More

Image: Left Skewed Histogram

Left Skewed Histogram: A Comprehensive Guide to Understanding, Interpreting, and Applying Skewed Data Distributions

One pattern that consistently challenges even seasoned professionals is the left-skewed histogram. In my years of consulting and teaching, I’ve seen how understanding these asymmetrical distributions — a key skill often honed through six sigma certification — can be a game-changer for businesses and project managers alike. Here’s what you’ll learn What is a Left […]

View More

Image: Comparing Left vs Right Skewed Histogram

Mastering Left vs Right Skewed Histogram: Unlocking Data’s Hidden Stories

In data analysis, not all distributions are created equal. In skewed histograms, where data tells a tale of asymmetry and hidden insights. Understanding the nuances between left skewed vs right skewed histogram/distributions is crucial for anyone navigating the complex landscape of statistics and data science, especially for professionals aiming for process improvement mastery. Foundational statistical […]

View More

Image: Analyzing and Presenting Right-Skewed Histogram

Right-Skewed Histogram: A Master Black Belt’s Guide to Asymmetric Data Analysis

Approximately 70% of real-world data distributions do not follow the typical bell curve. It is especially common in finance and business to find histograms that are right-skewed, but these histograms are often misunderstood. By the end of this article, you’ll understand A six sigma certification can take your understanding further, equipping you to apply these […]

View More

Image: Standard Error vs Standard Deviation

Understanding the Difference: Standard Error vs. Standard Deviation

In the world of statistics, two terms often cause confusion and debate among researchers, data analysts, and students alike: standard error and standard deviation. While they may sound similar, these statistical measures play distinct roles in data analysis and interpretation. Understanding the difference between a standard error vs standard deviation is not just an academic […]

View More

Image: Choosing between Standard Deviation vs Variance

Standard Deviation vs Variance. A Complete Guide for Data Analysis Professionals

Standard Deviation and Variance are crucial in comprehensive data analysis. It helps achieve actionable data that can further be used to optimize manufacturing processes, assess financial risk, or improve customer satisfaction. The insights gained from properly utilizing standard deviation and variance prove invaluable. By the end, you’ll be able to These skills are essential for […]

View More

Image: Affinity Grouping

Affinity Grouping: Boosting Productivity in Product Management

Imagine transforming a chaotic brainstorming session into a structured, actionable plan in just a few hours. That’s the power of affinity grouping. Where decisions need to be made quickly and effectively, mastering this technique can be a game-changer for product managers, UX researchers, business analysts, and team leaders alike. Affinity grouping is more than just […]

View More

Image: Top Industry Specific Problem Solving Techniques

20 Powerful Problem-Solving Techniques for the Modern Workplace: A Comprehensive Guide

Here’s a fact… Organizations that are great at solving problems are about 3.5 times more likely to grow their income faster than other companies! But what’s so crucial about problem-solving that makes such a big impact? What is Problem-Solving? Problem-solving is about finding and fixing issues that stop a company from reaching its goals. Being […]

View More

Image: Project Scope Statement

Project Scope Statement: The Key to Project Success

A well-crafted project scope statement, much like the principles taught in Six Sigma certification programs, can be the difference between project success and failure. A project scope statement is a comprehensive document that defines the boundaries, deliverables, and objectives of a project. It serves as a roadmap for the entire project team, stakeholders, and clients, […]

View More

Image: What is a PICK Chart?

What is a PICK Chart? How it Works in Six Sigma & Lean Manufacturing

Figuring out what to focus on can make or break a project. I’ve found a tool that helps with projects, especially figuring out which ones to tackle first. That’s where the PICK chart comes in handy. PICK stands for Possible, Implement, Challenge, and Kill. It’s a way to sort your projects into four groups. It […]

View More