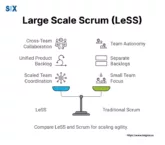
fbpx

Articles

Image: Mood's Median Test

Mood’s Median Non-Parametric Hypothesis Test. A Complete Guide

Often in stats research, teams encounter the imperative for comparing groups/samples’ central tendencies. While ANOVA frequently helps, it requires normalcy and homogeneity. When extremes or non-normality mar data, non-parametric exams better interpret. One such is Mood’s median test, which bears its discoverer’s name. Designed by comparing medians of independent sets, it proves beneficial for exploratory […]

View More

Image: Focus Diagram

Create an Effective FAST (Function Analysis System Technique) Diagram

Continual optimization of outputs, provisions, and operations underpins commercial survival today. FAST Diagram(s) does just that. FAST (Function Analysis System Technique) diagramming logically highlights what adds importance while pruning waste and lessness. Emerging from value assessment, FAST mapping spreads widely – within lean, Six Sigma, and refinement projects. Their talent parses convolutions into groundwork functions […]

View More

Image: Attribute Data

Attribute Data: Unlocking Insights with Categorical Excellence

Really grasping different data types is crucial for making smart choices and refining workflows. One category that deserves more attention is attribute data. Also called qualitative or discrete data, attribute data describes object, product or process traits. Unlike continuous info measured on scales, it is usually sorted into categories and counted. Some examples include defect […]

View More

Image: Screening 7 Factors in 8 Runs with Plackett Burman Design

Design of Experiments: Plackett–Burman designs

Many scientific trials involve various influences potentially shaping results. Screening tactics like Plackett-Burman designs optimize probing them when budgets and hours prove limited. Plackett-Burman emerged through statisticians’ work in the ‘40s as a proficient, economical technique within the Design of Experiments (DoE) pinpointing prime movers. It lets researchers expeditiously gauge numerous determinants utilizing comparatively slight […]

View More

Image: Is/Is not analysis

Is/Is Not Analysis: A Powerful Problem-Solving Technique for Peak Performance

Businesses face all kinds of hurdles slowing progress and threatening success. From grindingly slow workflows to quality glitches, these problems spread damage far if left unaddressed. But with the right problem-solving styles, companies can pinpoint what’s causing trouble and implement fixes well. One such method earning its stripes across industries everywhere is “Is/Is Not Analysis”. […]

View More

Image: Cost of Conformance

Understanding Cost of Conformance: All You Need To Know

Requirements are evolving rapidly, guaranteeing quality and meeting industry protocols underpins survival. However, compliance comes with a “conformity cost” tag – assets, efforts, and investments maintaining oversight and remedies. These quality assurance outlays include defect prevention, checks, and non-meeting fixes. Importantly, conformity costs impact enterprises enormously across fields. Ignoring such expenses risks sizable monetary losses, […]

View More

Image: Coefficient of Variation

Coefficient of Variation: Mastering Relative Variability in Statistics

Grasping and utilizing the coefficient of variation (CV) is hugely important for stats analysis and workflow refinement. The CV, also called relative standard deviation, is a scale-free stats metric that quantifies how data scatters around the average. It provides a standardized way to compare variability between data sets, even when the raw units or scales […]

View More

Image: Normal Probability Plot

Normal Probability Plot Explained. A Detailed Guide

Normal Probability Plot visually show just how closely information points align with the standard normal distribution. These plots take the percentiles from observed values compared to normal percentiles, lining them up graphically. If we notice an almost straight line, the data likely adheres to a normal curve. Significant line divergence, however, may signify otherwise. Normal […]

View More

Image: 8D Corrective Action

8D Corrective Action: Mastering Problem-Solving for Continuous Improvement

Businesses constantly refine products, services, and workflows to stay ahead. But issues can still pop up, angering customers and jacking costs while hurting a company’s image. This is where the 8D corrective action problem-solving method earns its stripes. It was developed by Ford in the 80s and has since spread widely across manufacturing, healthcare, aerospace, […]

View More

Image: Lead Time in Supply Chain and Project Management

Lead Time – How Does it Work? A Complete Guide

Lead time has grown vital across industries. Also called cycle time or throughput, it sums the ordering start till delivery end. This yardstick holds weighty consequences in supply chain governance, directly impacting customer happiness, stock degrees, and efficiency all in all. Competitively meeting clientele fast-morphing anticipations hinges on lead time administration. Whether churning solid manufactured […]

View More

Image: ANOVA F Value Meaning

ANOVA F Value: Mastering Signal-to-Noise Ratio for Data Analysis

Stats analysis is so important for improving and optimizing workflows, and ANOVA is a powerful technique. It allows comparing averages across multiple groups or sets of data. A key element in it is the ANOVA F value. This statistic serves as the main indicator of whether differences seen in group averages are statistically meaningful or […]

View More

Image: Quality Concepts - Interrelationship Digraph

Quality Concepts – Interrelationship Digraph. Everything to Know

Businesses encounter many complicated issues needing thorough knowledge of how factors interlink. This is where Interrelationship Digraph, a helpful visual approach, prove beneficial. Also called relationship maps, they let teams diagram connections and dependencies within any system or process. This aids in pinpointing root sources, interaction loops, and rippling effects from changes. Widely applied in […]

View More

Image: Focus PDCA

Focus PDCA: Drive Continuous Improvement & Business Excellence

Constantly refining workflows is now key for businesses everywhere to stay ahead. Whether boosting product quality, streamlining operations, or better satisfying customers – having a solid process to fuel fact-based enhancements is huge. This is where the focus PDCA cycle steps up as a helpful tool. It lets companies methodically pinpoint chances for upgrades, enact […]

View More

Image: Multi-Generational Product Planning (MGPP)

Multi-Generational Product Planning (MGPP) for Product Success.

Developing products well-fit for now and tomorrow requires smart, future-focused planning. Multi-Generation Product Planning (MGPP) is a comprehensive method allowing organizations to properly manage and improve their goods lineups over the years. It sees the full product lifespan, from concept to retirement. It accounts for generations after while coordinating portfolio roadmaps with company targets, tech […]

View More

Image: Main Effects Plot

Main Effects Plot: Driving Process Excellence Through Data-Driven Analysis

One of an analyst’s most useful tools is the main effects plot – a straightforward yet super valuable graphical technique for pinpointing the key factors influencing a process or system. In the world of Design of Experiments (DoE) and Analysis of Variance (ANOVA), the main effects plot visually shows how different levels of an independent […]

View More

Image: Andon Cord

Andon Cord in Lean Manufacturing. Toyota Production System

In lean manufacturing, the andon cord represents empowerment, quality focus, and constant upgrading. This clever idea from Toyota’s famous production model has transformed manufacturing management. It places quality ownership directly with assembly line employees. The andon cord, often a brightly colored rope along the production line, acts as a straight connect between workers and their […]

View More

Image: Multi-vari Chart

Multi-Vari Chart: Powerful Tools for Process Analysis and Improvement

One of the most flexible and revealing tools in the Six Sigma toolbox is the multi-vari chart. This graphical method lets you see and study the different causes of variation in a process. The multi-vari chart is a handy diagnostic that helps pinpoint and fix the root sources of process inconsistencies. This article will give […]

View More

Image: Process Analysis

Process Analysis: The Key to Operational Efficiency and Business Transformation

Businesses constantly look for ways to smooth out operations, boost efficiency, and fuel constant upgrading. Process analysis has emerged as a powerful tool for achieving this. Process analysis involves carefully examining a series of linked actions or steps that together achieve something. It aims to uncover issues, roadblocks and chances to improve how things currently […]

View More

Image: Operating Characteristic Curve (OC Curve)

How to Use Operating Characteristic Curve. A Complete Guide

Sampling inspection is commonly used in quality to evaluate products and services. However, looking only at a part of the full selection introduces risks, as conclusions apply to the entire amount. This is where Operating Characteristic (OC) curve become handy. They provide a clear way to study and better design sampling plans. OC curves visually […]

View More

Image: Normality Test

All About Normality Test in Statistical Analysis. Lean Six Sigma

In statistics, the assumption of normality test plays a big role in ensuring results make sense and can be relied on. Many common tests like t-tests, ANOVA, and regression analyses assume data fits under a bell curve shape. Not meeting this assumption can lead to wrong conclusions and beliefs that can’t be trusted. Normality tests […]

View More