Articles

Image: Operational Cost Reduction

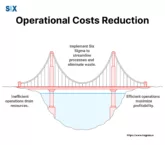
Operational Cost Reduction: Slashing Expenses with Lean Six Sigma

What if a silent leak was draining up to 30% of your company’s revenue each year? For many businesses, this isn’t a hypothetical; it’s the reality of unchecked operational costs. These inefficiencies—from wasted materials to redundant processes—are more than just expenses; they are barriers to growth and profitability. Begin Your Transformation Empower your team with […]

View More

Image: Reduce Manufacturing Defects

Reduce Manufacturing Defects: A Step-by-Step Six Sigma Guide

The hidden costs of poor quality can consume 15-20% of a company’s total sales revenue. For a $10 million business, that’s up to $2 million annually lost to scrap, rework, warranty claims, and customer returns. But the true cost is even higher. It’s the damage to your brand’s reputation, the erosion of customer trust, and […]

View More

Image: Central Limit Theorem

Understanding The Central Limit Theorem In Quality Control

The central limit theorem stands as a fundamental principle in statistical quality control, transforming how manufacturers monitor and improve their production processes. This statistical concept explains why quality control teams can make reliable decisions about entire production batches by testing only small samples. Statistical Foundation For Six Sigma The central limit theorem provides the mathematical […]

View More

Image: Quality Control Plan

The Guide to Creating an Effective Quality Control Plan in Six Sigma [2025]

A quality control plan serves as the foundation for maintaining product and service standards across organizations. This systematic approach defines processes, responsibilities, and metrics to ensure consistent quality outputs. Modern businesses implement these plans to meet customer expectations, reduce operational costs, and maintain their competitive edge in the market. Key Highlights About Quality Control Plans […]

View More

Image: Quality Control in Manufacturing

The Guide to Quality Control in Manufacturing: Strategies, Tools, and Best Practices

Quality control in manufacturing forms the backbone of successful production operations worldwide. Modern manufacturing facilities rely on robust quality control processes to maintain product excellence, reduce waste, and ensure customer satisfaction. Manufacturing quality control involves systematic monitoring and evaluation of production processes to meet specified standards. Key Highlights What Is Quality Control in Manufacturing? Quality […]

View More

Image: Taguchi Method

The Guide to the Taguchi Method: A Robust Quality and Efficient Experimentation

Achieving robust quality and efficient production is paramount. That’s where the revolutionary Taguchi method comes into play – a powerful approach to design of experiments and quality control that has transformed industries worldwide. Developed by the pioneering engineer Genichi Taguchi, this methodology optimizes processes to minimize defects and variations, even in the face of uncontrollable […]

View More

Image: Spaghetti Diagram

The Definitive Guide to Spaghetti Diagrams: Streamlining Processes

Spaghetti diagram is a powerful lean visualization tool that allows you to quite literally untangle the knots in your processes. With just a glance, you can identify redundancies, wasteful movement, and areas ripe for optimization. Visualize and eliminate process inefficiencies by effectively using Spaghetti Diagrams Learn to streamline workflows with our Lean Six Sigma Green […]

View More

Image: Run Chart vs Control Chart

Run Chart vs Control Chart: Mastering Quality Management Tools

In quality management, choosing the right data visualization tool can make or break your process improvement efforts. Whether you’re a quality control professional, a project manager, or a Six Sigma practitioner, understanding the nuances of a run chart vs control chart is crucial for making informed decisions about your process improvement initiatives. Key Highlights Introduction […]

View More

Image: Kamishibai Boards

Kamishibai Boards in Lean Manufacturing. How Do They Work?

We strive to make operations better and optimized, surrounded by constant change. So, how do we keep up and also ensure effective and successful ops? This is where Kamishibai boards revolutionize the game. These boards got their start long ago in Japanese storytelling. Now they have changed to help factories. Kamishibai boards combine keeping it […]

View More

Image: SPC Charts

SPC Charts: The Ultimate Guide to Statistical Process Control & Quality

Introduced by Walter Shewhart’s pioneering work and then enhanced through W. Edwards Deming, SPC charts offer visual representations showcasing workflow shifts. Organizations pursue steady excellence, leading to widespread Statistical Process Control adoption – a potent tool for observation, analysis, and progression. By graphing data against calculated boundaries, charts discern natural flux from source-worthy deviations. SPC […]

View More

Image: 7 Quality Control Tools

The 7 Quality Control Tools: A Comprehensive Guide for Quality Excellence

Quality proves pivotal for organizational endurance and success. Whether a seasoned quality guiding hand or a newcomer to the field, the 7 Quality Control tools stand as treasured companions to advance one’s abilities. Esteemed quality pioneer Kaoru Ishikawa unveiled these 7 tools amid Japan’s post-war awakening, fashioning statistical quality principles accessible for all experiences and […]

View More

Image: Process Tolerance

Process Tolerance: Balancing Quality & Cost | A Comprehensive Guide

Ensuring quality while optimizing costs is so important. This delicate balance surfaces through comprehensive knowledge and application of process tolerance – a core concept in quality control and enhancement techniques like Six Sigma. With over two decades as a Master Black Belt, I’ve seen process tolerancing’s profound impacts firsthand working extensively with major brands. Insights […]

View More

Image: What is Quality Control Management?

All about Quality Control Management in Lean Six Sigma

Consistently delivering high-quality products or services is a must to succeed. Customers expect reliability, dependability, and adherence to what’s promised, making quality management so crucial to operations. It’s an all-encompassing method involving processes, techniques, and tools aimed at ensuring things meet predefined quality standards and customer needs. Quality control management is systematic yet flexible, centering […]

View More

Image: Average Outgoing Quality (AOQ)

AOQ (Average Outgoing Quality) in Six Sigma. How Does it Work

Average Outgoing Quality (AOQ) offers significant bits of knowledge regarding associations’ nature control viability. Quality assumes extraordinary significance in today’s aggressive commercial scene for maintaining client fulfillment. It steps imperfect units inadvertently conveyed after testing. Calculating and watching AOQ (Average Outgoing Quality) empowers assessing testing designs, recognizing update spaces, and the right issues. Key Highlights […]

View More

Image: Measles Chart

Measles Chart in Six Sigma. A Definitive Guide

Associations consistently search for approaches to extracting bits of knowledge from information to help basic leadership. Measles chart additionally called X-Y plots or scatter diagrams, successfully envision process execution information, permitting designs, patterns, and peculiarities distinguished. They get their name from comparability to measles diseases’ memorable taints. Information centers regularly shape groupings mirroring these. This […]

View More

Image: CUSUM Charts

Mastering CUSUM Charts: The Key to Detecting Small Process Shifts

For processes where even slight variations carry major implications, promptly noticing and fixing minor shifts assumes critical priority, and this is where CUSUM charts come in play. While common charts like Shewhart adequately track many scenarios, they can occasionally miss subtle process transformations. This highlights the value of CUSUM charts. They provide a strong yet […]

View More

Image: Andon Cord

Andon Cord in Lean Manufacturing. Toyota Production System

In lean manufacturing, the andon cord represents empowerment, quality focus, and constant upgrading. This clever idea from Toyota’s famous production model has transformed manufacturing management. It places quality ownership directly with assembly line employees. The andon cord, often a brightly colored rope along the production line, acts as a straight connect between workers and their […]

View More

Image: Multi-vari Chart

Multi-Vari Chart: Powerful Tools for Process Analysis and Improvement

One of the most flexible and revealing tools in the Six Sigma toolbox is the multi-vari chart. This graphical method lets you see and study the different causes of variation in a process. The multi-vari chart is a handy diagnostic that helps pinpoint and fix the root sources of process inconsistencies. This article will give […]

View More

Image: Defect Concentration

Complete Guide to Defect Concentration Diagram in Lean Six Sigma

Finding and fixing flaws in products is super important. Defect Concentration Diagram or DCD have become a helpful visual method teams use. These diagrams provide an easy-to-understand picture of where faults happen, how often, and if there is a pattern. They map issues right onto a graphic of the item or part. DCDs offer a […]

View More