Articles

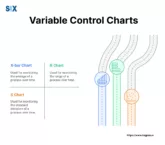
Image: Variable Control Charts (Shewhart Charts)

Variable Control Charts: The Complete Guide to Process Monitoring and Control

Understanding how to effectively use a Variable Control Chart is fundamental to modern Statistical Process Control (SPC). Unlike attribute charts that track count data (like defect numbers), variable charts offer deeper insights into process performance by analyzing actual measurements. The concept originated in the 1920s when Walter Shewhart, a physicist and engineer at Bell Laboratories, […]
View More

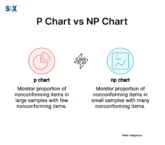
Image: p chart vs np chart

P-chart vs Np-chart in Lean Six Sigma. All You Need to Know

Quality monitoring relies partly on attribute charts like P chart and NP chart. P charts gauge proportions defective when test bunch sizes stay steady. NP charts instead track non-compliant units directly when batch quantities fluctuate. Both adhere to the binomial distribution modeling independent trials’ success/failure probabilities—the essential attributes a binary nature. P chart and NP […]

View More

Image: np-chart

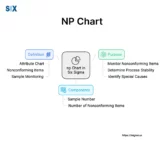
Lean Six Sigma Methodology. What is Np-chart?

Quality monitoring and workflow refinement are important for any business to consistently fulfill client demands. Statistical process control approaches prove helpful statistical tools here. One effective gizmo specifically applicable to quality metrics involves the np chart. Short for “nonconforming units”, np charts track defective quantities amid test samples/batches. Employed where characteristics measure binary (compliant/noncompliant), np […]

View More

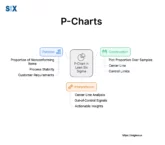
Image: P-charts

Six Sigma Terminology – P chart. What is it and How it Works

Organizations bank on reliable quality and minimal defects fuelling success. An outstanding ally hitting that target involves the p-chart, also known as the proportion control chart. This potent statistical technique tracks and analyzes non-compliant piece rates over time within methods. It’s handy when data classifies each unit simply as “hits standard” or “misses standard” based […]

View More

Image: U-charts

U Chart Guide: Monitoring Defects per Unit for Quality Control

Quality charts prove invaluable aids. Among options, U-charts stand as a treasure controlling non-compliances observed per item when dealing with varying batch sizes. Dubbed the “defects-per-unit control graph“, the U-chart helps quality experts track typical non-compliance amounts discovered per unit or area inspected. Unlike counterparts simply noting complete non-compliance counts, it scales findings by batch […]

View More

Image: EWMA Chart

Exponentially Weighted Moving Average (EWMA) Charts. Everything to Know

Statistical procedure control methods assume basic estimation parts in organizations over industry spectra now. Among systems, Exponentially Weighted Moving Average (EWMA Chart) outlines have significance for distinguishing minor continuous procedure changes better than ordinary control diagrams. EWMA chart delegate exponentially diminishing loads to past information focuses, concentrating additional on ongoing perceptions when exacting normal. This […]

View More

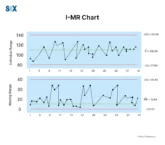
Image: I-MR Chart

I-MR Chart in Lean Six Sigma. Everything You Need to Know

Maintaining a consistent product/service quality is imperative for success in modern times. Techniques like Statistical Process Control (SPC) empower organizations to monitor, assess, and control process variation, powering better quality with lesser resource consumption and driving continuous improvement efforts like Six Sigma. SPC has various tools in its arsenal, among which the I-MR (Individual and Moving […]

View More

Image: Control Limits in Six Sigma

What are Control Limits? Leveraging Statistical Boundaries for Process Excellence

One indispensable tool that has consistently proven its value across various industries is the concept of control limits within Statistical Process Control (SPC). Control limits are the guardrails that delineate the acceptable range of variation within a process, acting as sentinels for detecting deviations and anomalies that could compromise quality and consistency.  By establishing these […]

View More

Featured Image: Control Charts in Six Sigma

The Ultimate Guide to Control Charts in Six Sigma. Achieve Process Excellence

Control charts in Six Sigma are statistical process monitoring tools that help optimize processes by identifying variations.  They were introduced by Dr. Walter Shewhart as part of his work on statistical quality control in the 1920s. Control charts display process data over time which enables the identification of special and common causes of variation. This […]

View More

control charts six sigma

Control Charts, DMAIC and the Level Six in Six Sigma

Control charts are a very important tool if you are to successfully implement Six Sigma in your business or organization. This visual is great because it puts everything in the form of a graphic so that you can compare through tracking a process input or an output over time. Since there are different types of […]

View More