Articles

Image: Product Prioritization Matrix

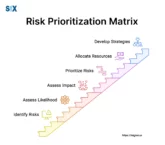
Product Prioritization Matrix: A Guide for Product Teams

The product prioritization matrix is one of the most powerful and proven invaluable tools. The product prioritization matrix provides a structured and data-driven method for evaluating product features based on various criteria like customer demand, business impact, and implementation. Key Highlights What is a Product Prioritization Matrix? A product prioritization matrix is a powerful visual […]

View More

Image: Risk Prioritization Matrix

A Complete Guide to Risk Prioritization Matrix. Best Practices, Tools, and More

The risk prioritization matrix evaluates threats’ likelihood and consequences visually in priority levels for smart resource allocation. This technique smoke-screens critical risks meriting prompt approach. It cultivates prudence while promoting proactive mindsets to preempt worsening troubles. It aligns best practices supporting informed resolution. Overall risk prioritization acts strategically for quality optimization and competitive positioning through […]

View More

Image: p chart vs np chart

P-chart vs Np-chart in Lean Six Sigma. All You Need to Know

Quality monitoring relies partly on attribute charts like P chart and NP chart. P charts gauge proportions defective when test bunch sizes stay steady. NP charts instead track non-compliant units directly when batch quantities fluctuate. Both adhere to the binomial distribution modeling independent trials’ success/failure probabilities—the essential attributes a binary nature. P chart and NP […]

View More

Image: np-chart

Lean Six Sigma Methodology. What is Np-chart?

Quality monitoring and workflow refinement are important for any business to consistently fulfill client demands. Statistical process control approaches prove helpful statistical tools here. One effective gizmo specifically applicable to quality metrics involves the np chart. Short for “nonconforming units”, np charts track defective quantities amid test samples/batches. Employed where characteristics measure binary (compliant/noncompliant), np […]

View More

Image: Residual Analysis

Everything to Know About Residual Analysis

Regression analysis proves a potent statistical technique relating outcome variables to one or more influence variables. However, models heavily rely on sound foundations and quality information. Here residual examination plays an essential role in assumptions evaluation and fit adequacy assessment. Residuals describe gaps between observed outcome values and those predicted. Containing valuable clues about performance, […]

View More

Image: Agile Planning

Everything You Need to Know About Agile Planning. A Definitive Guide

Traditional project planning methods often drowning in extensive upfront mapping and inflexible frameworks flounder pacing innovation’s relentlessness. This is where agile planning glides in — a pliant, evolving alternative fueling operations adaptive capabilities. Core to the Agile way, it spotlights teamwork, constant refining, and buying focus above all else. Recognizing needs change en route, inspires […]

View More

Image: Process Tolerance

Process Tolerance: Balancing Quality & Cost | A Comprehensive Guide

Ensuring quality while optimizing costs is so important. This delicate balance surfaces through comprehensive knowledge and application of process tolerance – a core concept in quality control and enhancement techniques like Six Sigma. With over two decades as a Master Black Belt, I’ve seen process tolerancing’s profound impacts firsthand working extensively with major brands. Insights […]

View More

What are Process Indicators? Measure, Manage, Optimize, and More

These days, businesses must constantly work toward workflow mastery and streamlined processes. Process indicators become hugely important here, quantifying how processes measure up. These stats serve as handy tools for tracking, analyzing, and refining business methods. They let companies pinpoint upgrade opportunities and make choices backed by data often supported by methodologies likeĀ Six Sigma certificationĀ programs […]

View More

Image: Drum-Buffer-Rope (DBR)

Drum Buffer Rope (DBR): Maximize Throughput & Lead Time with ToC Methodology

The Drum-Buffer-Rope (DBR) method, a key part of the Theory of Constraints (TOC) developed by Eliyahu M. Goldratt, focuses on optimizing overall performance by properly addressing limiting factors. The TOC views constraints as opportunities for improvement. At its core, DBR scheduling aims to boost throughput and flow by strategically managing the constraint or main restriction. […]

View More

Image: Current Reality Tree

Current Reality Tree: A Powerful Tool for Root Cause Analysis and Improvement

The Current Reality Tree stands out as an insightful method for tackling intricate, deep-seated issues that organizations face. With roots in the Theory of Constraints, the CRT provides a clear way of systematically understanding problems. By mapping how undesirable events and effects are all connected, and tracing them back step-by-step to the core drivers behind […]

View More

Image: Lean Management Tools

Lean Management Tools. All the Tools You Need to Achieve Six Sigma

Associations consistently search for approaches that streamline cycles, improve profitability, and convey premium estimations to clients. Advancement originated from Toyota’s creation framework where discharge, non-ending upgrades, and regard drive viability. These standards bypass assembling impacts over social insurance, programming, development, and administration vitally. Lean instruments consolidate methodologies upgrading viability by recognizing and expelling non-valuable exercises […]

View More

Image: Six Sigma Certification Cost

Six Sigma Certification Cost: A Comprehensive Guide by a Master Expert

Six Sigma distinguishes itself as an exceptionally gifted resolution and refining framework. From manufacturing refinement to business process streamlining and beyond, Six Sigma’s fundamentals illuminate intricate challenges profoundly – optimizing operations, boosting quality standards, and driving resolutions empirically. Of course, any transformation harbors obstacles. For Six Sigma fluency, among the toughest presents is the certification’s […]

View More

Image: Measles Chart

Measles Chart in Six Sigma. A Definitive Guide

Associations consistently search for approaches to extracting bits of knowledge from information to help basic leadership. Measles chart additionally called X-Y plots or scatter diagrams, successfully envision process execution information, permitting designs, patterns, and peculiarities distinguished. They get their name from comparability to measles diseases’ memorable taints. Information centers regularly shape groupings mirroring these. This […]

View More

Image: Payoff Matrix

Mastering Payoff Matrices: Power of Strategic Decision-Making Tools

Navigating intricacy and choosing prudently hold prime significance. Fortunately, payoff matrix emerge as potent sense-makers. Through over two decades guiding transformational change, I’ve witnessed matrices’ gifts firsthand time and again across various terrains. Essentially, these visual organizers furnish structured comprehension beyond instinct. By mapping options and their effects, matrices illuminate the nuanced interweaving amid counterpart […]

View More

Image: Spider Chart

Spider Chart in Six Sigma. All You Need to Know

Inside our information-driven situation, adequately depicting and imparting multifaceted information remains fundamental. Also called radar or web charts, Spider Chart emerge as an intense apparatus for breaking down and dissecting multivariate information. They give a special, limited way to look at a few measurable factors over different classes or elements, making them important in assorted […]

View More

Image: Full Factorial Design

Full Factorial Design: Comprehensive Guide for Optimal Experimentation

The full factorial design distinguishes itself as a robust, enlightening experimentation approach across industries. At its core, this systematic method examines multiple metrics’ collective effects on an outcome simultaneously. Considering all factor level combinations furnishes holistic comprehension beyond individual impacts—illuminating intricate relationships shaping complex systems’ behaviors. The factorial design’s strength lies in realistically emulating dynamics’ […]

View More

Image: Degrees of Freedom in Statistics (df Statistics)

Degrees of Freedom in Statistics. Everything You Need to Know

Degrees of opportunity (df statistics) assume a fundamental part in deciding investigation exactness and legitimacy. Regardless of whether directed speculation tests, fitting relapse models, or exploring information, understanding df statistics is pivotal for drawing educated ends. Degrees of flexibility speak to the measure of figures free to fluctuate amid factual computations. It measures how much […]

View More

Image: Bimodal Histogram

Bimodal Distribution Histogram in Lean Six Sigma: Guide to Data-Driven Decision-Making

A bimodal histogram graphically depicts data exhibiting two distinct peaks in the distribution or modes. This signifies two separate groups or processes within a single dataset. Various factors can produce such a unique pattern, like merged operations, combined populations, or natural bimodality seen in some study fields. Key Highlights Understanding Bimodal Distributions and Their Histograms […]

View More

Image: Lot Tolerance Percent Defective (LTPD)

LTPD (Lot Tolerance Percent Defective) in Lean Six Sigma

Quality checks assume pivotal jobs in each assembling or creation process. Representative testing utilizes tests on item tests rather than each. Inside this, the Lot Endurance Percent Detrimental (LTPD) assumes a basic part in choosing regardless of whether a delivery or outfit ought to be acknowledged or dismissed given imperfection levels. Key Highlights What is […]

View More

Image: Lurking Variable

What are Lurking Variables? Definition, Examples, and More

Within analytic and measurable examination, concealing factors stay a hushed yet compelling power decidedly affecting considers legitimacy and translations. These imperceptible variables, regularly disregarded or unconsidered, can contort genuine relations between considered fixings, bringing about predisposed results and misleading finish. Confounding variables, additionally called lurking variables, influence both free and subordinate variables being broken down […]

View More