
Articles

Image: Focus Diagram

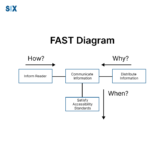
Create an Effective FAST (Function Analysis System Technique) Diagram

Continual optimization of outputs, provisions, and operations underpins commercial survival today. FAST Diagram(s) does just that. FAST (Function Analysis System Technique) diagramming logically highlights what adds importance while pruning waste and lessness. Emerging from value assessment, FAST mapping spreads widely – within lean, Six Sigma, and refinement projects. Their talent parses convolutions into groundwork functions […]


View More

affinity diagram

Organizing Information With An Affinity Diagram

Problem-solving in an organization requires collaborative brainstorming. Team members must collaborate to create solutions to pressing issues; an affinity diagram helps them do this effectively. This article will explain affinity diagrams and how to organize information with them. What is an affinity diagram? An affinity diagram is a business tool for organizing ideas and data. […]

View More

Ishikawa diagram

When to use Ishikawa Diagram?

What is Ishikawa diagram? The Ishikawa diagram portrays the causes of an effect and is used in manufacturing and other services such as product development. It outlines a process and its steps, shows where quality control problems might appear, and determines which resources are needed at given times.  Who invented it? It was first designed […]

View More

affinity diagram

Effective Brainstorming With Affinity Diagrams

Brainstorming sessions and the affinity diagram or tree diagram go together well. With it, teams can control the brainstorming process and systemically tackle a recurring issue efficiently and effectively. The tree diagram works by allowing the project team to brainstorm a lot of ideas and group them homogenous into categories. This allows the team to […]

View More