Operational Excellence with Visual Management Tools. A Complete Guide
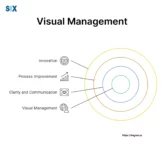
It’s important to understand and share information quickly. That’s why visual management tools are so useful. They’re a key part of efficient lean manufacturing. These tools include many different techniques and systems. They help make the workplace more organized, improve how work is done, and increase productivity. With these tools, everyone on the team can […]