All You Need to Know About Process Safety Management. The Only Guide You Need
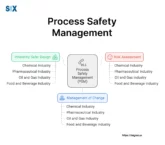
Process Safety Management (PSM) is a comprehensive preventative approach for inherently risky chemical-handling operations. The core aim is to involve preventing uncontrolled releases whose consequences endanger lives, property, or environments. By methodically identifying, weighing, and controlling process risks, PSM safeguards facilities, and surrounding communities. PSM empowers sustainable progress through opportunity management and hazard governance aligned […]