
Articles

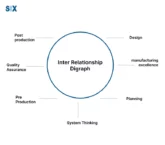
Image: Quality Concepts - Interrelationship Digraph

Quality Concepts – Interrelationship Digraph. Everything to Know

Businesses encounter many complicated issues needing thorough knowledge of how factors interlink. This is where Interrelationship Digraph, a helpful visual approach, prove beneficial. Also called relationship maps, they let teams diagram connections and dependencies within any system or process. This aids in pinpointing root sources, interaction loops, and rippling effects from changes. Widely applied in […]

View More

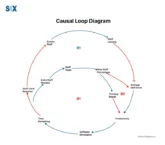
Featured Image: Causal Loop Diagram in Systems Thinking. Everything to Know

Causal Loop Diagram in Systems Thinking. Everything to Know

The challenges facing organizations are a result of interrelated factors. Handling these numerous issues requires a detailed understanding of the systemic structures and feedback loops that drive behaviors and outcomes.  Struggling to unravel complex system challenges? Master the art of systematic problem-solving with our Root Cause Analysis training! Organizations often turn to methodologies like Six […]

View More

fishbone diagram six sigma cause effect

The Fishbone Diagram is the “Wishbone” to the Cause

The fishbone diagram, created by Kaoru Ishikawa, is a simple tool for visually seeing the possible causes of an issue and how it affects the end result. The fishbone diagram is also referred to as the Ishikawa diagram, the cause and effect diagram, or the Ishikawa. When working as a team, to solve an issue, […]

View More