Articles

Image: Qualitative Data Analysis

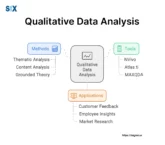
The Importance of Qualitative Data Analysis in Research: A Comprehensive Guide

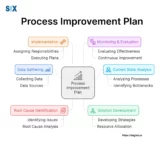
Qualitative data analysis, in essence, is the systematic examination of non-numerical information to uncover patterns, themes, and insights. This process is crucial in various fields, from product development to business process improvement. Key Highlights Introduction to Qualitative Data Analysis Qualitative data analysis is a sophisticated process of examining non-numerical information to extract meaningful insights. It’s […]

View More

Image: Principles of TQM (Total Quality Management)

Improve Quality and Customer Satisfaction with Total Quality Management (TQM)

Ongoing refinement of processes, services, and outputs remains key for consistent growth. This calls for Total Quality Management (TQM), and the principles of TQM, a crucial philosophy and tactic increasing perfection through betterment permeating an organization. With TQM, firms optimize consistency over competitors and secure long-term viability. Key Highlights What are Principles of TQM (Total […]

View More

Image: Sustainable Continuous Improvement

Continuous Improvement Strategies. A Guide to Sustainable Continuous Improvement

For companies to keep up nowadays, always changing and getting better proves key. Sustainable continuous improvement forms an excellent foundation for decades via methods like lean, Six Sigma, and kaizen streamlining procedures. Perpetually refining techniques, outputs and services minimizes environmental imprint while emphasizing shared responsibility cultivates viability, waste-reduction, and societal contributions. So, enterprises enhance competitiveness, […]

View More

Image: Business Process Improvement

Business Process Improvement: Why Every Company Should Implement It

Business Process Improvement is a systematic approach to identifying, analyzing, and enhancing existing business processes to achieve greater efficiency, effectiveness, and overall performance. Business Process Improvement serves as a critical tool in this endeavor, offering a structured methodology to streamline workflows, reduce costs, and ultimately deliver superior value to customers. Key Highlights Introduction to Business […]

View More

Image: Process Improvement Plan

The Importance of Having a Process Improvement Plan for Your Business

A process improvement plan is a strategic roadmap designed to enhance organizational efficiency, reduce waste, and boost overall performance. It’s a systematic approach that combines data-driven analysis with proven methodologies to identify, implement, and sustain meaningful changes in business processes. Key Highlights Understanding Process Improvement Plan Process improvement plan is the backbone of any successful […]

View More

Image: Project Charter vs Project Plan

Project Management Techniques. A Complete Guide to Project Charter vs Project Plan

Getting projects done right needs careful preparation, guidance, and monitoring. Two crucial papers are the project charter and the project plan. Project charters authorize the project and provide a basic outline of the work’s goals, boundaries, and teams. It approves and shares an understanding of what the project wants to accomplish. Project plans take high-level […]

View More

Image: Platykurtic Distribution

Platykurtic Distribution: Definition, Analysis & Applications

Platykurtic distribution is a statistical distribution characterized by its thinner tails compared to a normal distribution. This means it has fewer extreme values or outliers. They are uniquely useful for certain applications, especially those involving extreme events or outliers. Key Highlights What is a Platykurtic Distribution? A platykurtic distribution refers to a type of statistical […]

View More

A Complete Guide to the Anderson-Darling Normality Test

Scientists, engineers, and business people need to understand what kind of patterns their data follows. The normal distribution is one of the most common. But before using techniques that assume normal patterns, it’s good to check if the data matches the normal distribution shape. The Anderson-Darling normality test is a useful tool for checking how […]

View More

Image: Attribute Data vs Variable Data

Attribute Data vs Variable Data: Master the Difference for Quality Excellence

Attribute data also referred to as “go/no-go” information, is qualitative and describes whether a product or process meets a specific requirement or not. It is binary, indicating either conformance or nonconformance. On the other hand, variable data, known as “measurement information“, is quantitative and involves continuous measurements of characteristics such as length, weight, temperature, or […]

View More

Image: Difference between Correction vs Corrective Action

Correction Vs Corrective Action (Preventive Action). Everything to Know

Corrections remedy present concerns, removing deficiencies, and restoring norms. It resolves pressing nonconformity at hand. Corrective actions on the other hand target fundamental causes, getting rid of issues through investigating the root cause of nonconformities. Together they smoothly navigate fluctuations amid volatile climates, tightening consistency while retaining pliancy for organizations. Continuous refinement remains the heartbeat […]

View More

Image: Analytical Modeling

Analytical Modeling: A Guide to Data-Driven Decision Making

Analytical modeling is a comprehensive approach that employs mathematical models, statistical algorithms, and data analysis methods to understand, interpret, and predict outcomes based on historical data and known variables. At its core, it represents a quantitative and computational framework for dissecting intricate systems, identifying patterns, and informing strategic decision-making processes. Key Highlights Introduction to Analytical […]

View More

Image: A flow diagram showcasing Business As Usual (BAU)

Breaking Free from Business as Usual (BaU): Unleashing Continuous Improvement

Seeing business in the standard way has become an outdated notion unfit for organizations today. What once symbolized predictability and steadiness now poses serious risks to long-term staying power and competitiveness across industries. By challenging the usual beliefs behind business as usual (BaU), innovative systems empower companies to transcend process limitations, cultivating agility, customer focus, […]

View More

Image: Six Sigma Certification Cost

Six Sigma Certification Cost: A Comprehensive Guide by a Master Expert

Six Sigma distinguishes itself as an exceptionally gifted resolution and refining framework. From manufacturing refinement to business process streamlining and beyond, Six Sigma’s fundamentals illuminate intricate challenges profoundly – optimizing operations, boosting quality standards, and driving resolutions empirically. Of course, any transformation harbors obstacles. For Six Sigma fluency, among the toughest presents is the certification’s […]

View More

Image: DMAIC vs PDCA

DMAIC vs PDCA in Six Sigma. What Should You Pick and Why

Associations consistently search for approaches enhancing methodologies, quality, and proficiency. DMAIC (Define, Measure, Analyze, Improve, Control) and PDCA (Plan, Do, Check, Act), otherwise called the Deming or Shewhart cycles, end up noticeably useful in this quest. While both serve non-stopping upgrades and issue arrangements viably, they vary regarding technique, degree, and particular applications. DMAIC depends […]

View More

Image: Exit Criteria

Exit Criteria in Software Development: Ensuring Quality & Project Success

Where quality and productivity assume prime significance, exit criteria emerge as pivotal management and assurance mechanisms. Essentially, it comprise predestined prerequisites or milestones requiring satisfaction before deeming a software project or specific phase concluded for advancement. Guiding comprehensive development and testing journeys systemically, these exit waypoints secure ultimate offerings fulfilling the acutest excellence, functionality, and […]

View More

Image: Measles Chart

Measles Chart in Six Sigma. A Definitive Guide

Associations consistently search for approaches to extracting bits of knowledge from information to help basic leadership. Measles chart additionally called X-Y plots or scatter diagrams, successfully envision process execution information, permitting designs, patterns, and peculiarities distinguished. They get their name from comparability to measles diseases’ memorable taints. Information centers regularly shape groupings mirroring these. This […]

View More

Image: Cost Modeling

Cost Modeling in Lean Manufacturing. How Does it Work?

Cost modeling/displaying alludes to making budgetary models expecting usable expenses and directing choices. It uses measurements like factual investigation, operational look, and budgetary displaying to anticipate costs. The point is giving associations information for productive yet focused valuing, assessing new musings or extending viability, distinguishing cost-sparing open doors, and long haul arranging. Generally speaking, cost […]

View More

Image: Payoff Matrix

Mastering Payoff Matrices: Power of Strategic Decision-Making Tools

Navigating intricacy and choosing prudently hold prime significance. Fortunately, payoff matrix emerge as potent sense-makers. Through over two decades guiding transformational change, I’ve witnessed matrices’ gifts firsthand time and again across various terrains. Essentially, these visual organizers furnish structured comprehension beyond instinct. By mapping options and their effects, matrices illuminate the nuanced interweaving amid counterpart […]

View More

Image: Spider Chart

Spider Chart in Six Sigma. All You Need to Know

Inside our information-driven situation, adequately depicting and imparting multifaceted information remains fundamental. Also called radar or web charts, Spider Chart emerge as an intense apparatus for breaking down and dissecting multivariate information. They give a special, limited way to look at a few measurable factors over different classes or elements, making them important in assorted […]

View More

Image: Full Factorial Design

Full Factorial Design: Comprehensive Guide for Optimal Experimentation

The full factorial design distinguishes itself as a robust, enlightening experimentation approach across industries. At its core, this systematic method examines multiple metrics’ collective effects on an outcome simultaneously. Considering all factor level combinations furnishes holistic comprehension beyond individual impacts—illuminating intricate relationships shaping complex systems’ behaviors. The factorial design’s strength lies in realistically emulating dynamics’ […]

View More