24
(
)(
)
(
)²
Slope
x
y
x
y
n
x2
x
n
i
i
i
i
i
i
where:
x
i
= reference value
y
i
= bias
n = number of samples
Compute the linearity and percent linearity. Use the following
equations:
Linearity
=
Slope
x Process Variation
% Linearity
=
Linearity
Process variation
x 100
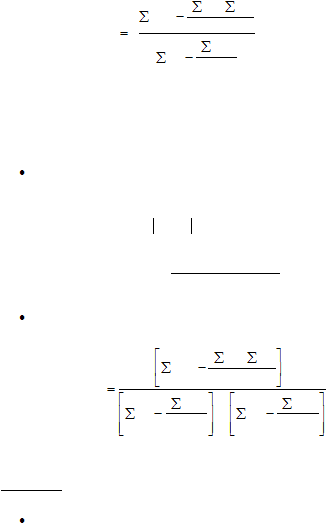
Compute the correlation coefficient, R2. Use the following equation:
(
)(
)
(
)2
(
)2
R
x
y
x
y
n
x²
x
n
x
y
y
n
2
i
i
i
i
i
i
i
2
i
2
Analysis:
The slope of the best fit linear regression line gives an indication of
how much the measurement instrument is inaccurate across the
entire process window for the characteristic at hand.
The closer to zero the slope, the “better” the instrument.