27
The data can then be entered into a software program such as
MINITAB
where it can be analyzed using the “Gage R&R Study -
ANOVA method”.
Analysis:
Plot the data.
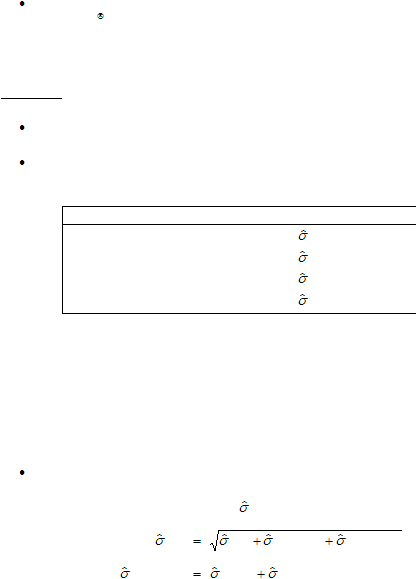
Perform an analysis of variance (ANOVA) on the data. The potential
sources of variability are as follows:
Source of Variability
Variance Component
Operators
O
2
Parts
P
2
Operators by Parts
OP
2
Repeatability
Repeatability
2
Figure 10. Designations for Sources of Variability
NOTE: Negative variance components are possible. If this
happens, do not set that variance component to zero. Instead, use
the modified analysis-of-variance method proposed by Milliken and
Johnson [12]. This procedure is also outlined nicely in Montgomery
and Runger [13]. See a statistician if you need help.
Calculate the total variation in the data using the following equation
Total Variation
=
Z
x
where
0
Total
Total
Parts
2
Repeatability
2
Reproducibility
2
Reproducibility
2
Operator
2
Operator by Part
2