19
What to look for to determine if the resolution is adequate:
There should be at least five distinct range levels when looking at the
range chart.
The smallest unit of measurement should be smaller than one-tenth
of the total six sigma process variation. Make sure that the estimate
of the process
comes from the process, and not just from the
samples in the measurement study.
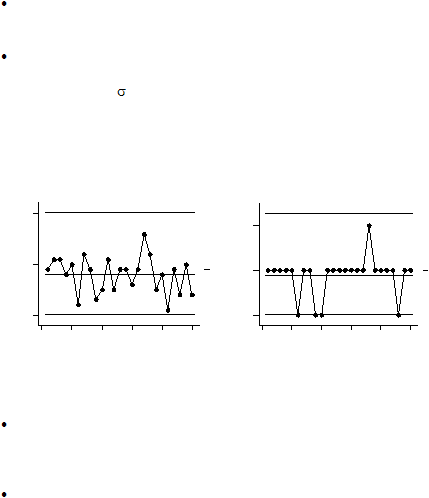
The following figure shows two R charts of the same characteristic.
The R chart on the left shows a measurement system in which the
smallest unit of measurement is 0.001”. This system has adequate
resolution.
The R chart on the right shows a measurement system in which the
smallest unit of measurement is 0.01”. This system has inadequate
resolution.
25
20
15
10
5
0
0.02
0.01
0.00
R
0.02039 (UCL)
25
20
15
10
5
0
0.02
0.01
0.00
R
0.02265 (UCL)
Figure 9. Acceptable and Unacceptable Resolution